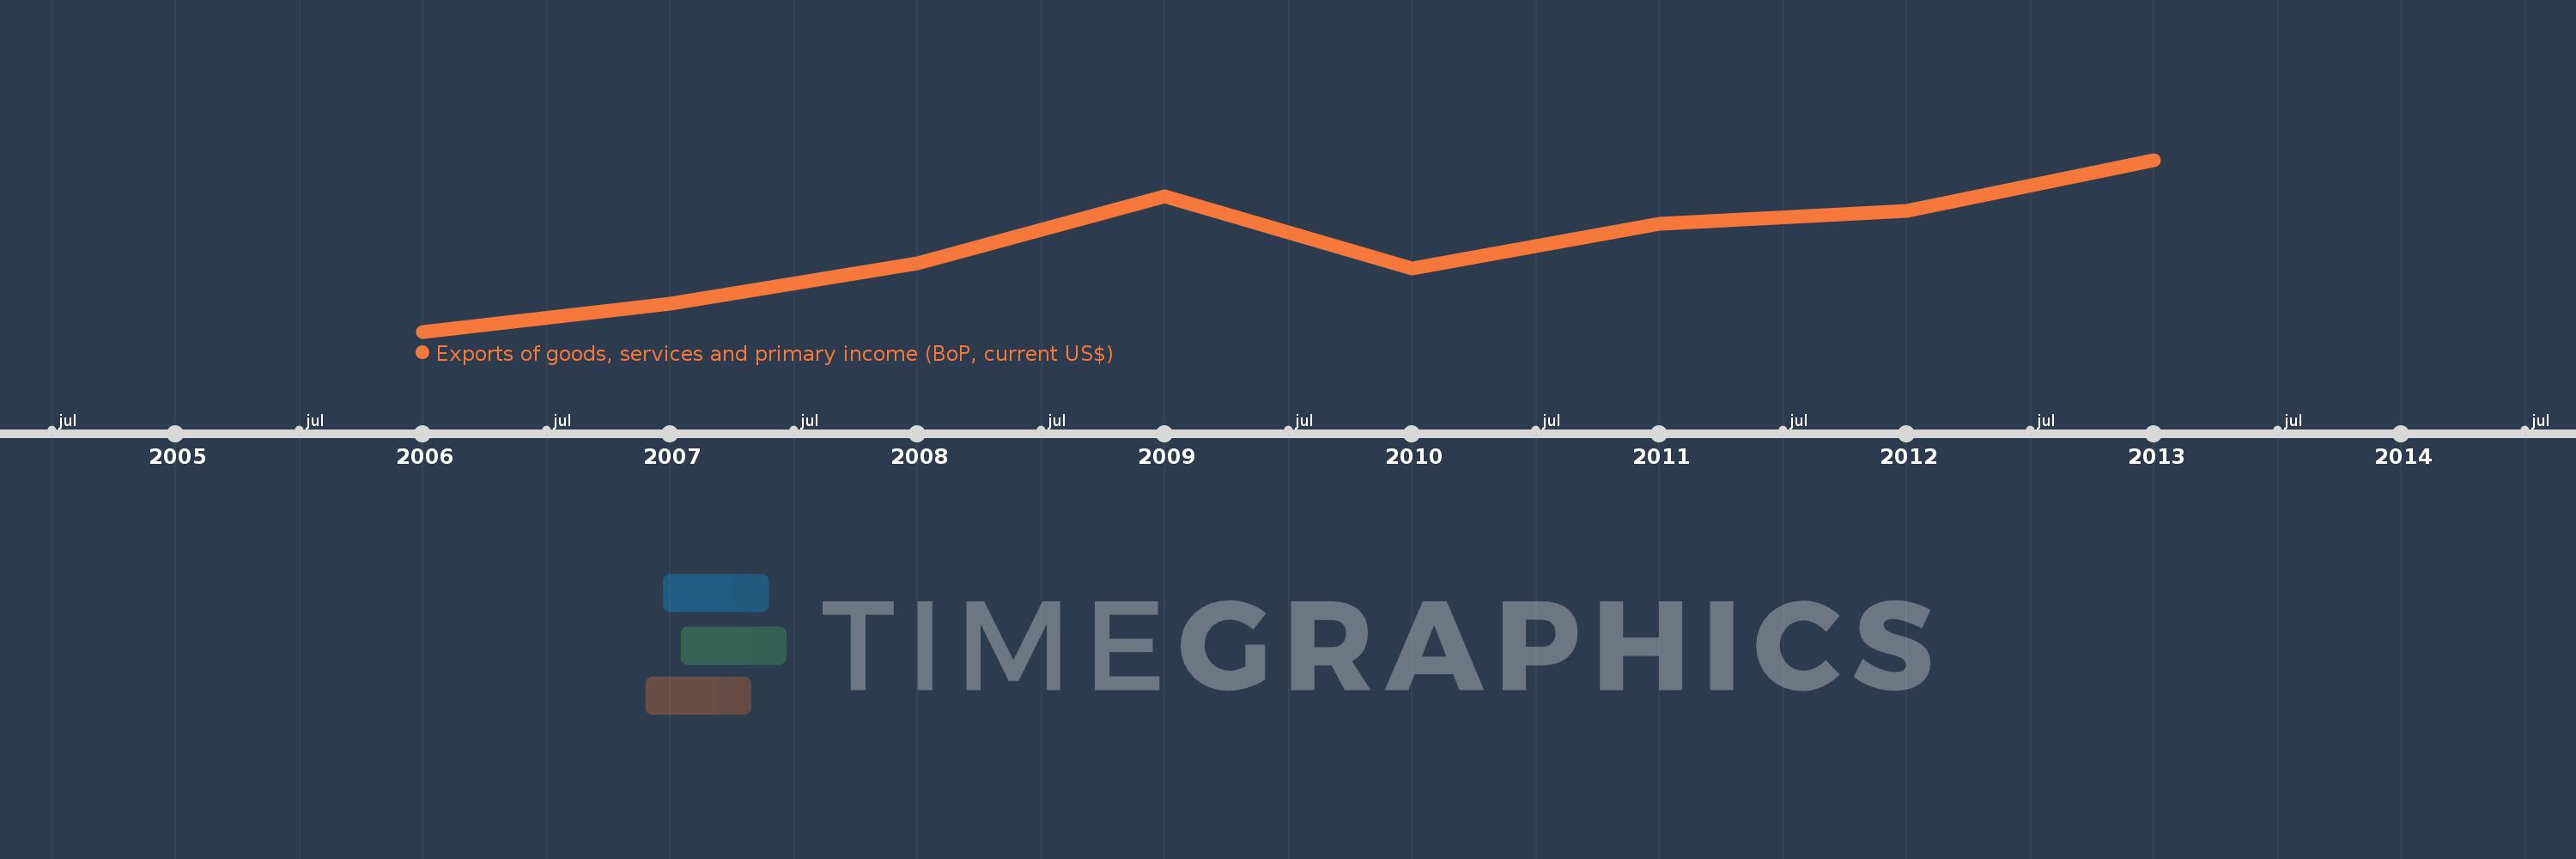
This timeline shows a graph from 2006 to 2013 of Fragile and conflict affected situations. No data until 2005. Number of actual observations by date: 8.
Source name:
World Development Indicators
Source organization:
International Monetary Fund, Balance of Payments Statistics Yearbook and data files.
Categories, topics:
Economy & Growth, External Debt, Trade
Last updated:
apr 23, 2017
Indicators value changes by year
Meaning:
222.524 bln
Minimum:
132.915 bln
jan 1, 2006
Maximum:
309.982 bln
jan 1, 2013
At the date of observation
Value
Absolute change
Change from the previous value
jan 1, 2006
132.915 bln
+132.915 bln
0.0%
jan 1, 2007
161.947 bln
+29.032 bln
21.84%
jan 1, 2008
203.403 bln
+41.456 bln
25.6%
jan 1, 2009
272.552 bln
+69.149 bln
34.0%
jan 1, 2010
198.43 bln
-74.122 bln
-27.2%
jan 1, 2011
243.716 bln
+45.286 bln
22.82%
jan 1, 2012
257.252 bln
+13.536 bln
5.55%
jan 1, 2013
309.982 bln
+52.73 bln
20.5%
Ranking of countries by current statistics by years