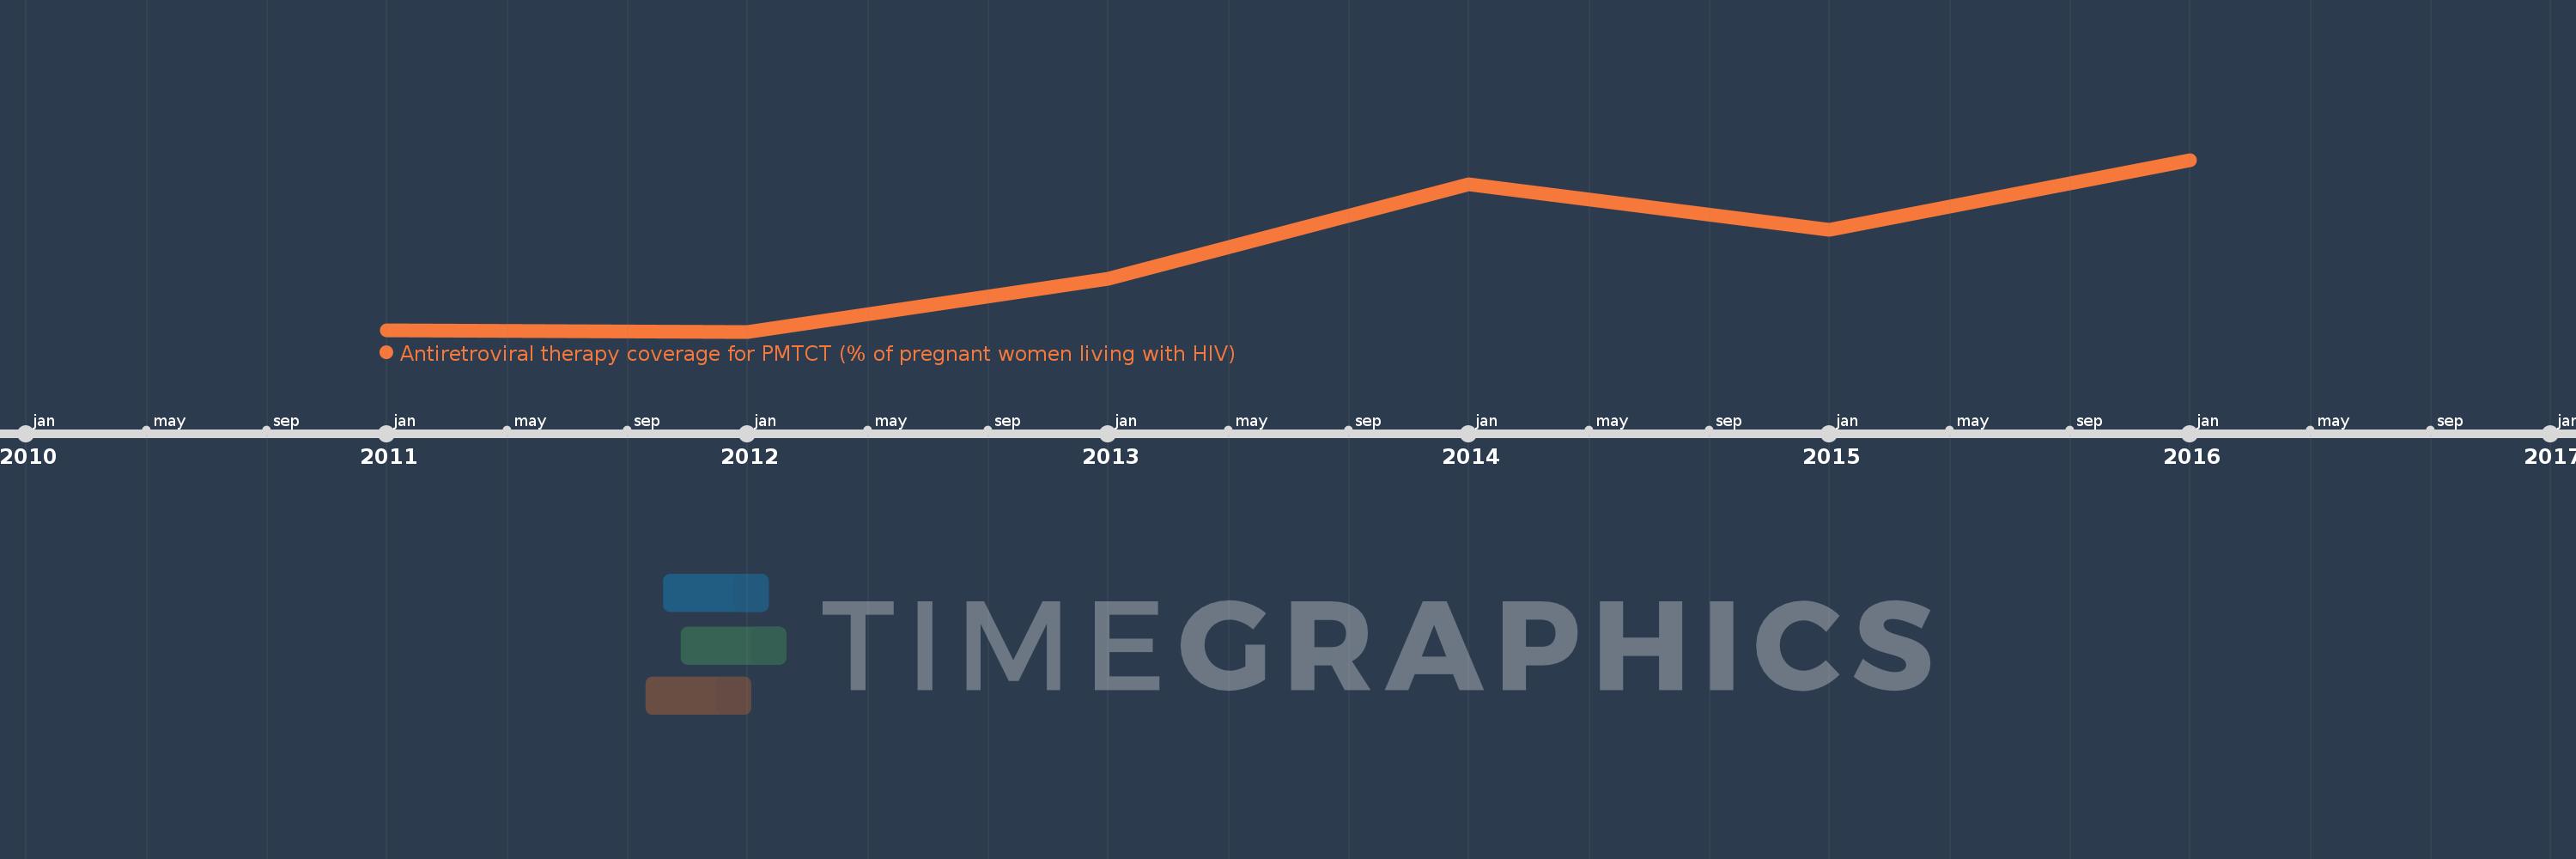
This timeline shows a graph from 2011 to 2016 of Middle East & North Africa (excluding high income). No data until 2010. Number of actual observations by date: 6.
Source name:
World Development Indicators
Source organization:
UNAIDS estimates.
Categories, topics:
Health
Last updated:
apr 23, 2017
Indicators value changes by year
Meaning:
21.914
Minimum:
19.156
jan 1, 2012
Maximum:
25.143
jan 1, 2016
At the date of observation
Value
Absolute change
Change from the previous value
jan 1, 2011
19.188
+19.188
0.0%
jan 1, 2012
19.156
-0.031
-0.16%
jan 1, 2013
21.0
+1.844
9.62%
jan 1, 2014
24.286
+3.286
15.65%
jan 1, 2015
22.714
-1.571
-6.47%
jan 1, 2016
25.143
+2.429
10.69%
Ranking of countries by current statistics by years