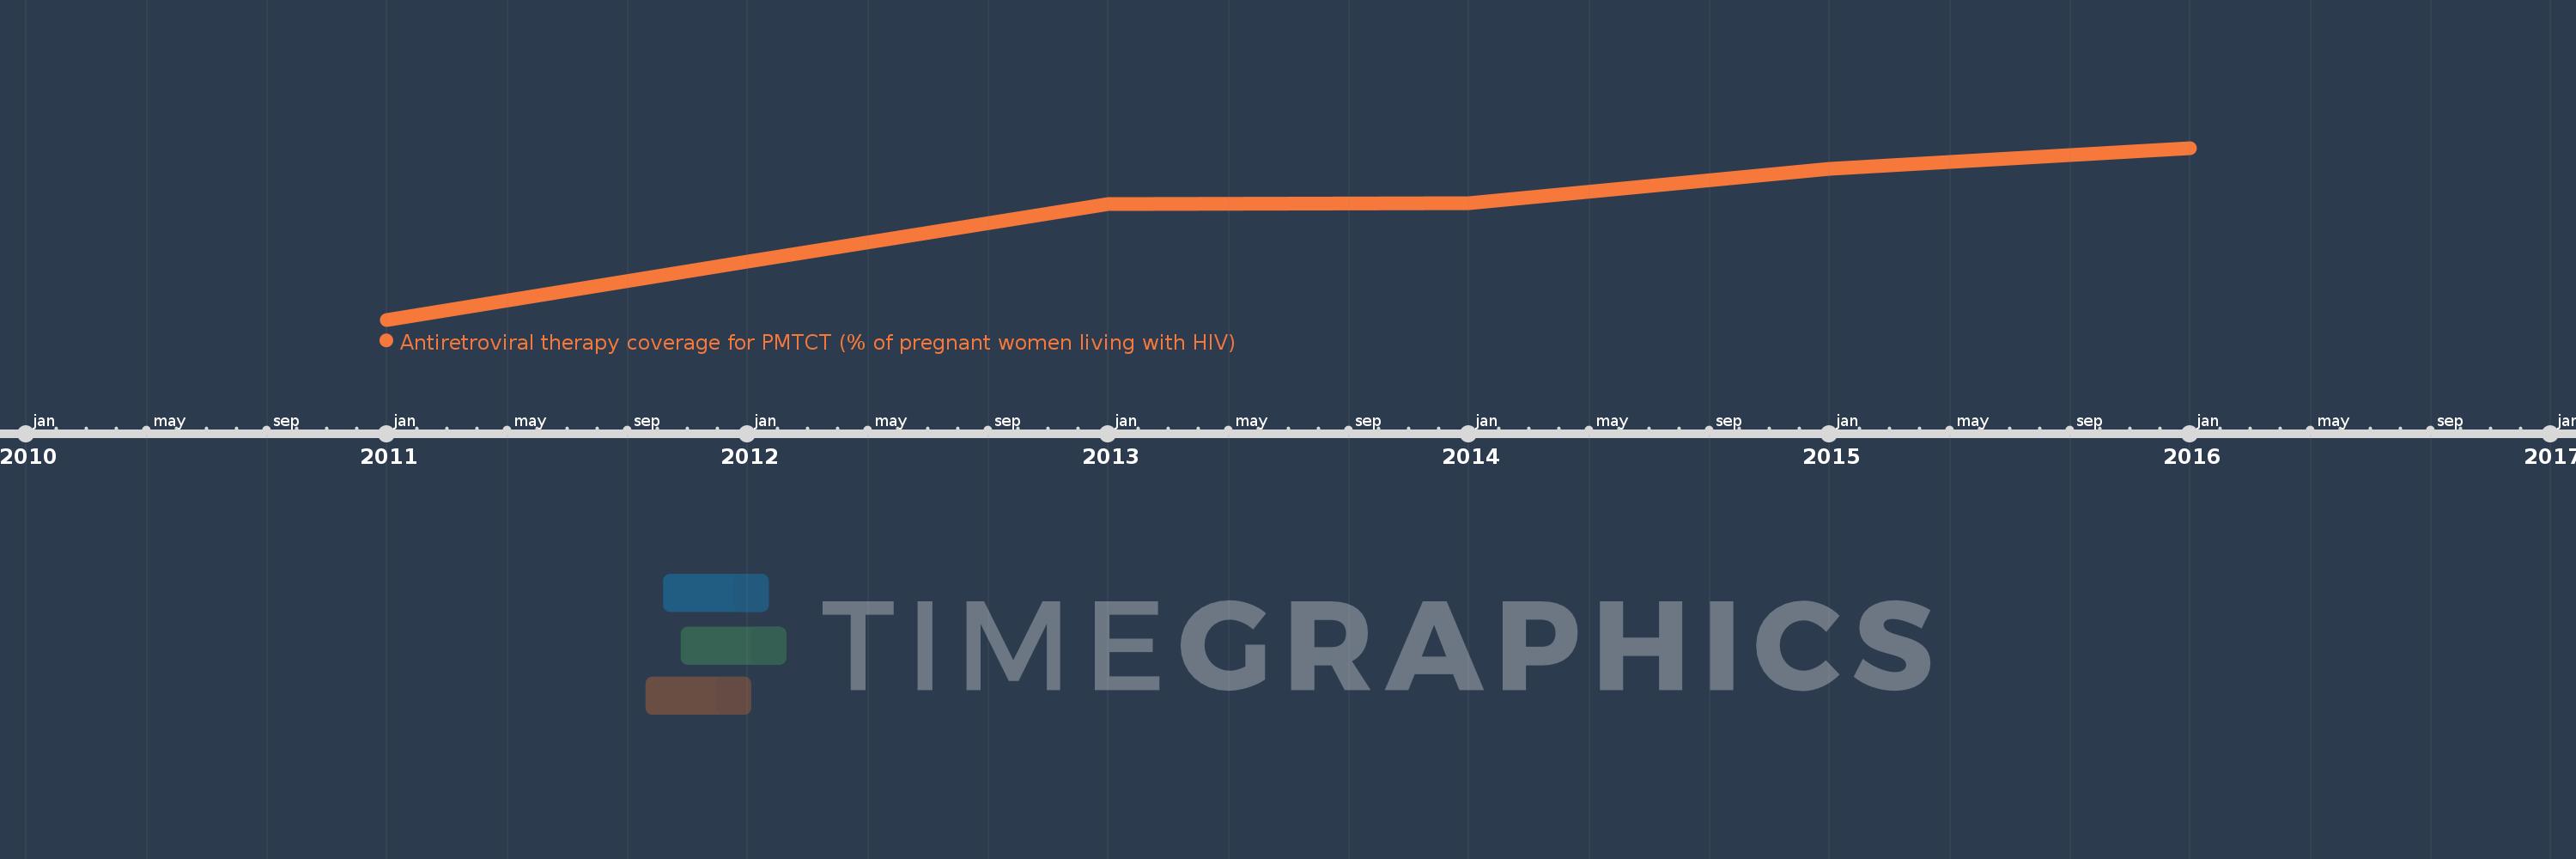
This timeline shows a graph from 2011 to 2016 of Least developed countries: UN classification. No data until 2010. Number of actual observations by date: 6.
Source name:
World Development Indicators
Source organization:
UNAIDS estimates.
Categories, topics:
Health
Last updated:
apr 23, 2017
Indicators value changes by year
Meaning:
65.44
Minimum:
40.489
jan 1, 2011
Maximum:
82.354
jan 1, 2016
At the date of observation
Value
Absolute change
Change from the previous value
jan 1, 2011
40.489
+40.489
0.0%
jan 1, 2012
54.675
+14.185
35.03%
jan 1, 2013
68.783
+14.109
25.81%
jan 1, 2014
68.985
+0.202
0.29%
jan 1, 2015
77.352
+8.367
12.13%
jan 1, 2016
82.354
+5.002
6.47%
Ranking of countries by current statistics by years