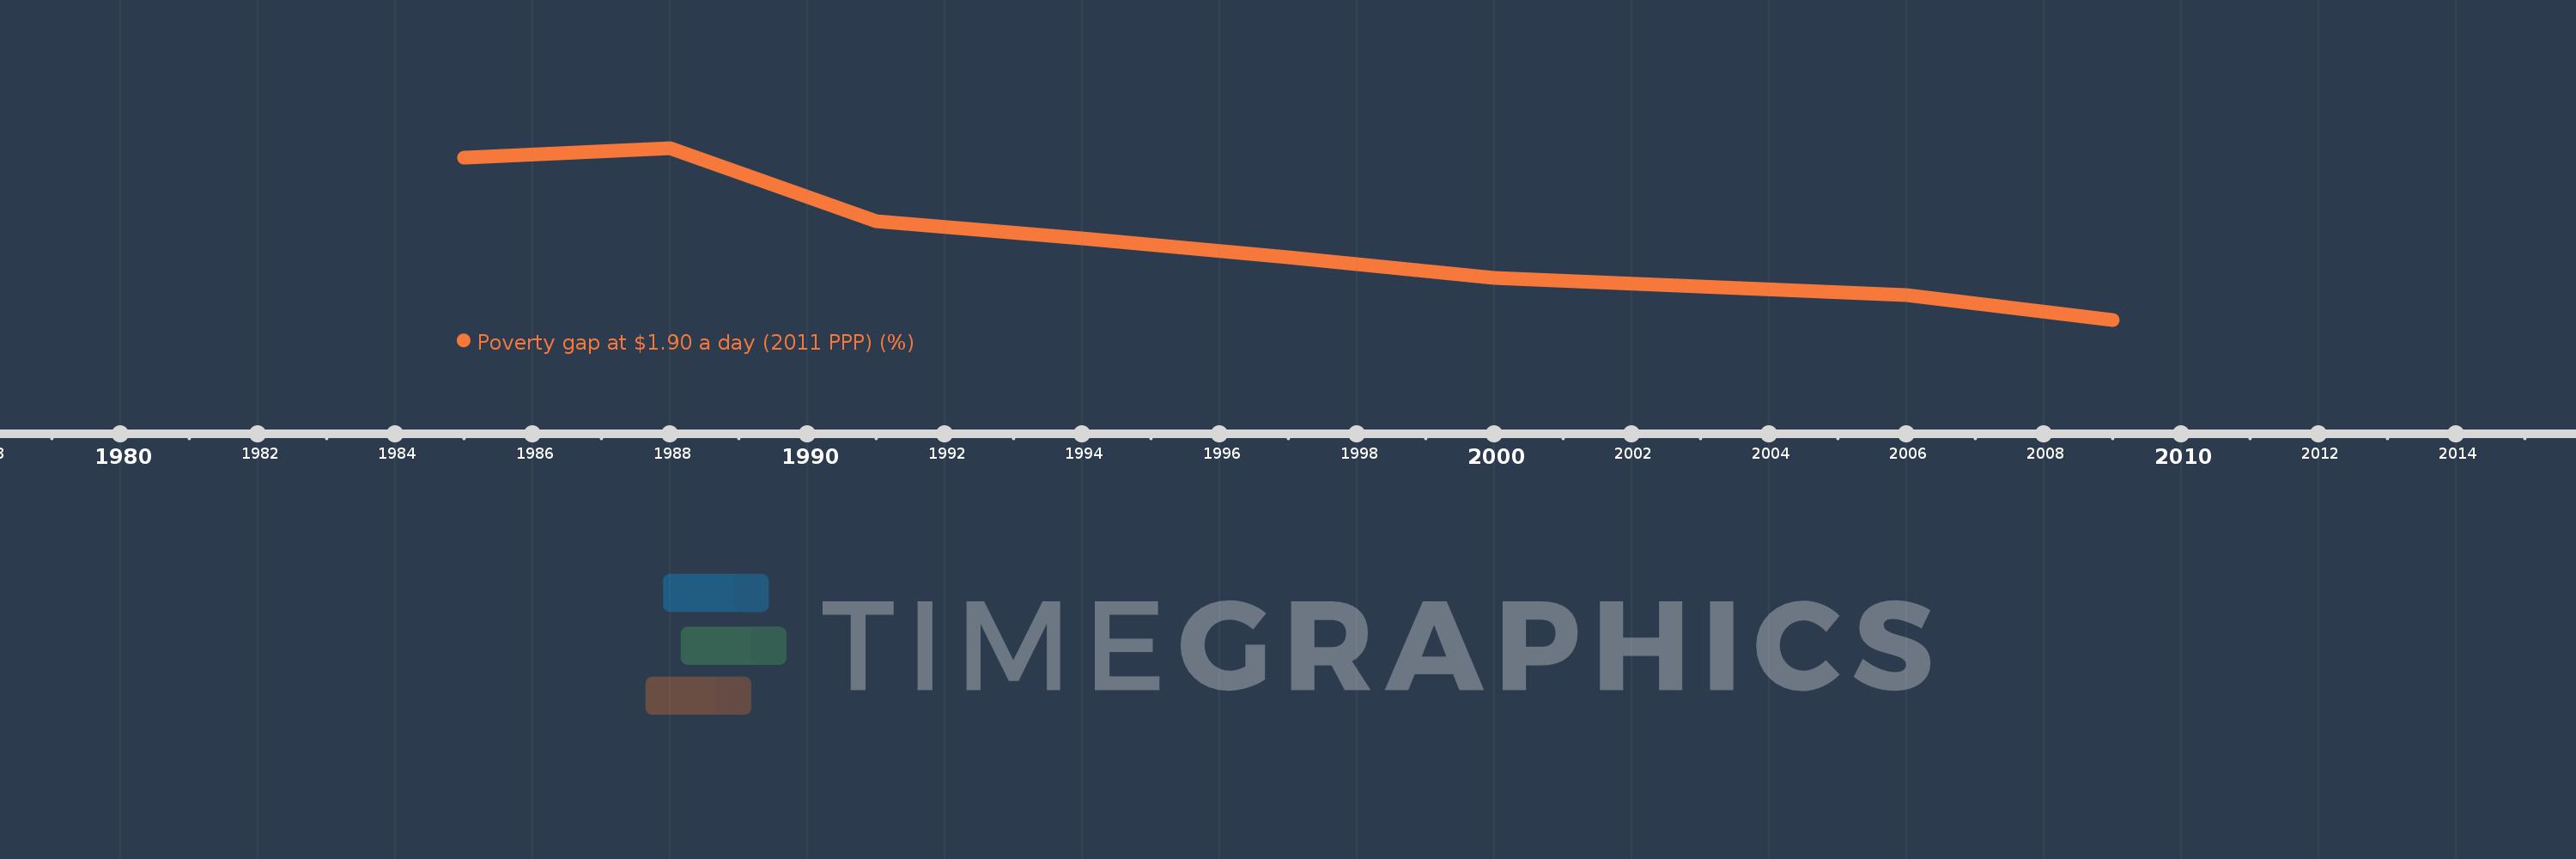
This timeline shows a graph from 1985 to 2009 of Middle East & North Africa. No data until 1984. Number of actual observations by date: 8.
Source name:
World Development Indicators
Source organization:
World Bank, Development Research Group. Data are based on primary household survey data obtained from government statistical agencies and World Bank country departments. Data for high-income economies are from the Luxembourg Income Study database. For more information and methodology, please see PovcalNet (http://iresearch.worldbank.org/PovcalNet/index.htm).
Categories, topics:
Poverty
Last updated:
apr 23, 2017
Indicators value changes by year
Meaning:
0.984
Minimum:
0.39
jan 1, 2009
Maximum:
1.66
jan 1, 1988
At the date of observation
Value
Absolute change
Change from the previous value
jan 1, 1985
1.59
+1.59
0.0%
jan 1, 1988
1.66
+0.07
4.4%
jan 1, 1991
1.12
-0.54
-32.53%
jan 1, 1994
0.99
-0.13
-11.61%
jan 1, 1997
0.85
-0.14
-14.14%
jan 1, 2000
0.7
-0.15
-17.65%
jan 1, 2006
0.57
-0.13
-18.57%
jan 1, 2009
0.39
-0.18
-31.58%
Ranking of countries by current statistics by years