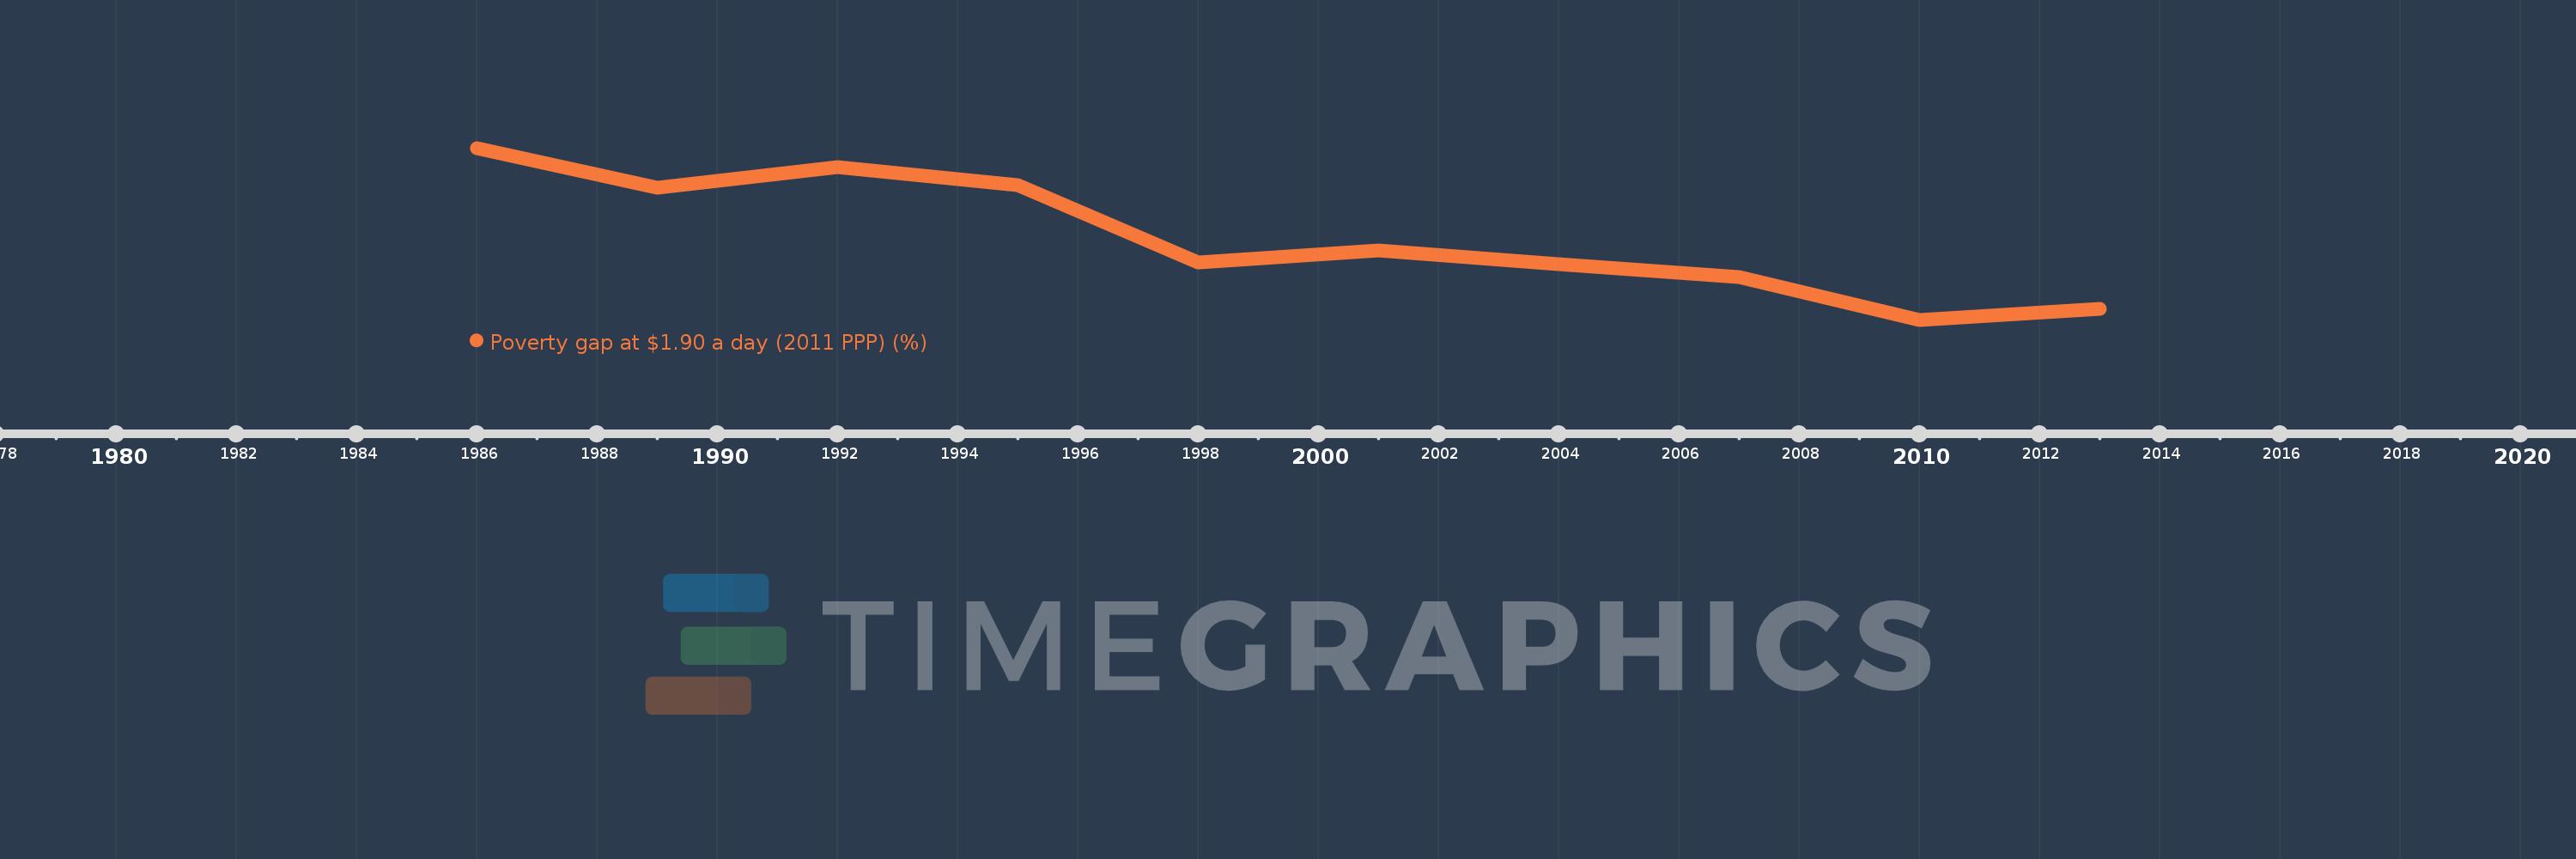
This timeline shows a graph from 1986 to 2013 of Philippines. No data until 1985. Number of actual observations by date: 10.
Source name:
World Development Indicators
Source organization:
World Bank, Development Research Group. Data are based on primary household survey data obtained from government statistical agencies and World Bank country departments. Data for high-income economies are from the Luxembourg Income Study database. For more information and methodology, please see PovcalNet (http://iresearch.worldbank.org/PovcalNet/index.htm).
Categories, topics:
Poverty
Last updated:
apr 23, 2017
Indicators value changes by year
Meaning:
4.818
Minimum:
2.43
jan 1, 2010
Maximum:
7.39
jan 1, 1986
At the date of observation
Value
Absolute change
Change from the previous value
jan 1, 1986
7.39
+7.39
0.0%
jan 1, 1989
6.23
-1.16
-15.7%
jan 1, 1992
6.83
+0.6
9.63%
jan 1, 1995
6.32
-0.51
-7.47%
jan 1, 1998
4.09
-2.23
-35.28%
jan 1, 2001
4.44
+0.35
8.56%
jan 1, 2004
4.04
-0.4
-9.01%
jan 1, 2007
3.67
-0.37
-9.16%
jan 1, 2010
2.43
-1.24
-33.79%
jan 1, 2013
2.74
+0.31
12.76%
Ranking of countries by current statistics by years