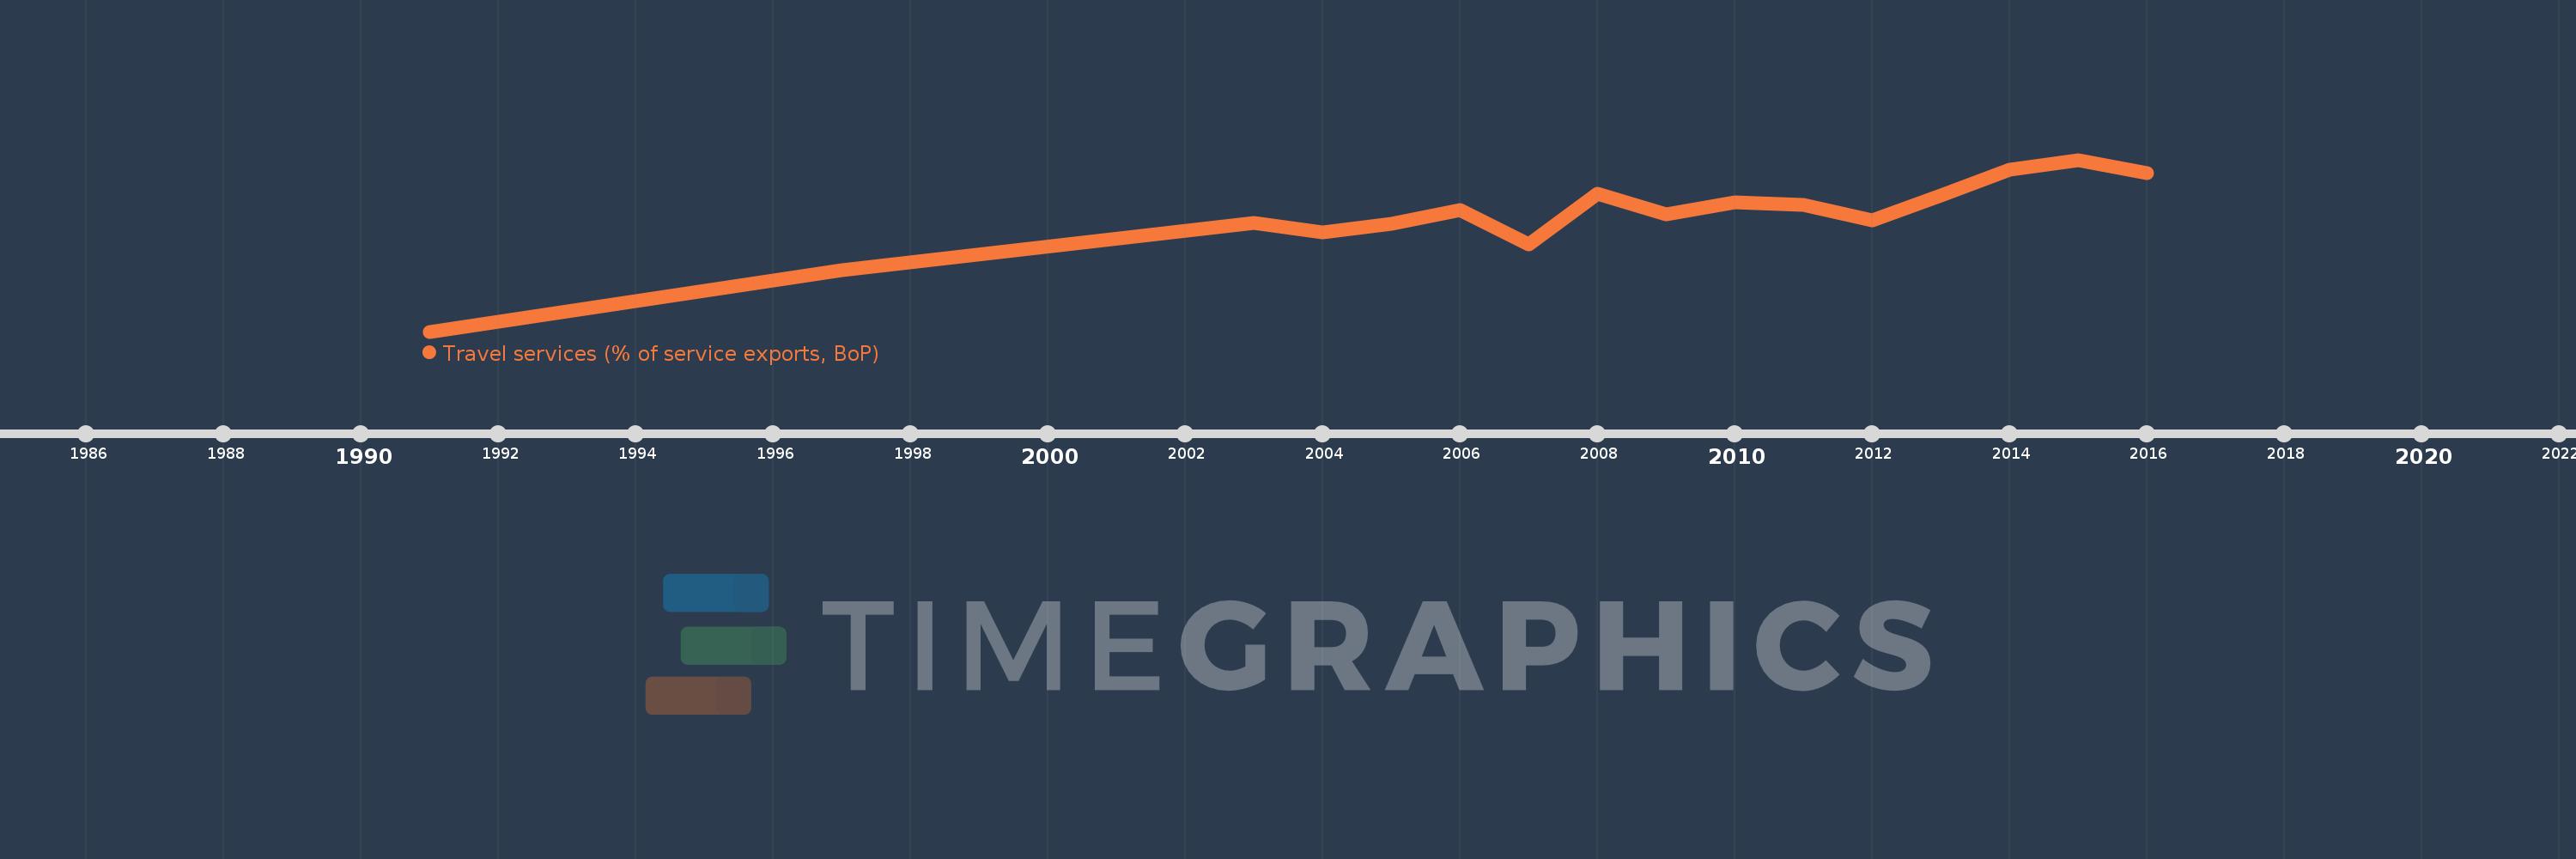
This timeline shows a graph from 1991 to 2016 of Least developed countries: UN classification. No data until 1990. Number of actual observations by date: 16.
Source name:
World Development Indicators
Source organization:
International Monetary Fund, Balance of Payments Statistics Yearbook and data files.
Categories, topics:
Economy & Growth, Trade
Last updated:
apr 23, 2017
Indicators value changes by year
Meaning:
41.492
Minimum:
26.158
jan 1, 1991
Maximum:
49.123
jan 1, 2015
At the date of observation
Value
Absolute change
Change from the previous value
jan 1, 1991
26.158
+26.158
0.0%
jan 1, 1997
34.32
+8.162
31.2%
jan 1, 2003
40.693
+6.373
18.57%
jan 1, 2004
39.382
-1.312
-3.22%
jan 1, 2005
40.597
+1.215
3.08%
jan 1, 2006
42.399
+1.803
4.44%
jan 1, 2007
37.792
-4.607
-10.87%
jan 1, 2008
44.628
+6.836
18.09%
jan 1, 2009
41.799
-2.829
-6.34%
jan 1, 2010
43.43
+1.631
3.9%
jan 1, 2011
43.096
-0.333
-0.77%
jan 1, 2012
40.987
-2.11
-4.9%
jan 1, 2013
44.335
+3.349
8.17%
jan 1, 2014
47.747
+3.412
7.69%
jan 1, 2015
49.123
+1.376
2.88%
jan 1, 2016
47.378
-1.744
-3.55%
Ranking of countries by current statistics by years