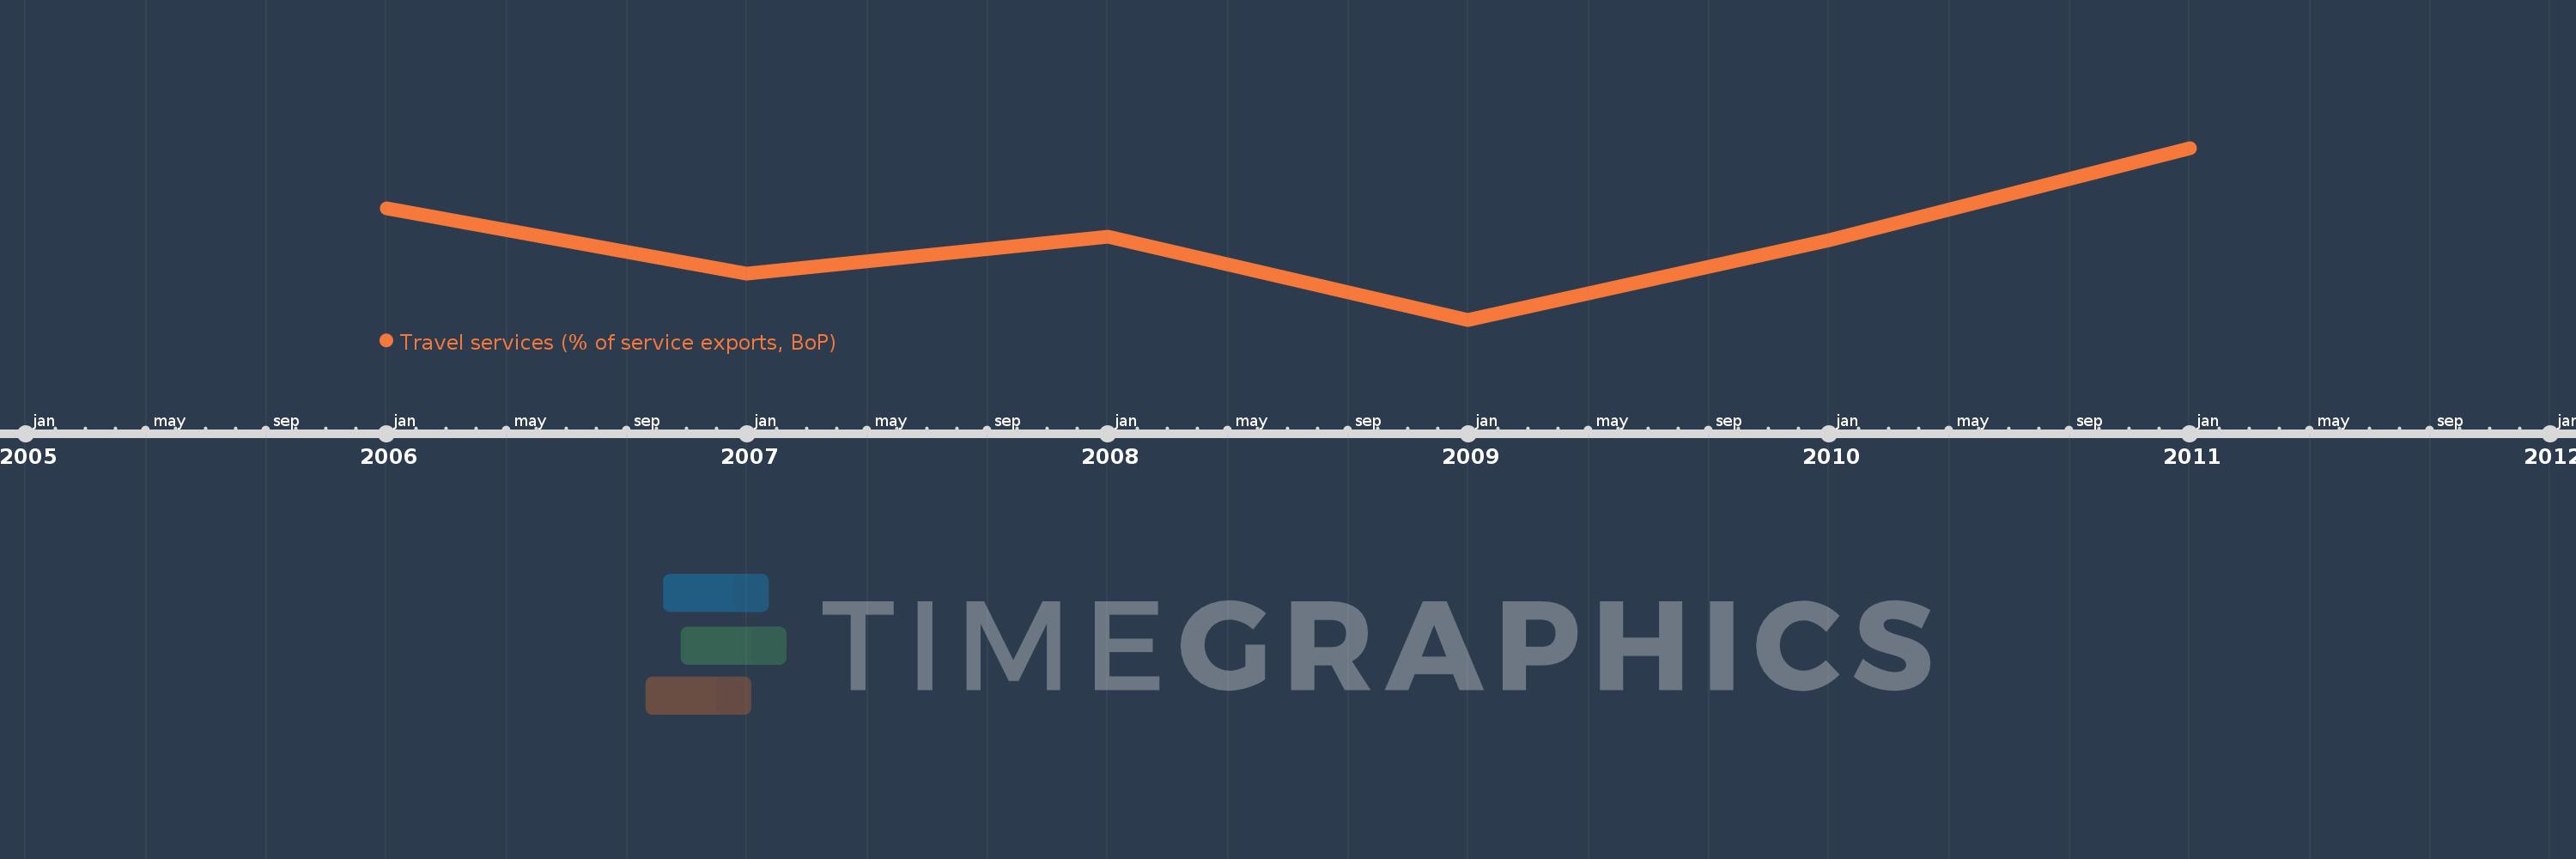
This timeline shows a graph from 2006 to 2011 of Fragile and conflict affected situations. No data until 2005. Number of actual observations by date: 6.
Source name:
World Development Indicators
Source organization:
International Monetary Fund, Balance of Payments Statistics Yearbook and data files.
Categories, topics:
Economy & Growth, Trade
Last updated:
apr 23, 2017
Indicators value changes by year
Meaning:
44.775
Minimum:
38.28
jan 1, 2009
Maximum:
51.899
jan 1, 2011
At the date of observation
Value
Absolute change
Change from the previous value
jan 1, 2006
47.111
+47.111
0.0%
jan 1, 2007
41.959
-5.152
-10.94%
jan 1, 2008
44.831
+2.872
6.84%
jan 1, 2009
38.28
-6.551
-14.61%
jan 1, 2010
44.568
+6.288
16.43%
jan 1, 2011
51.899
+7.331
16.45%
Ranking of countries by current statistics by years