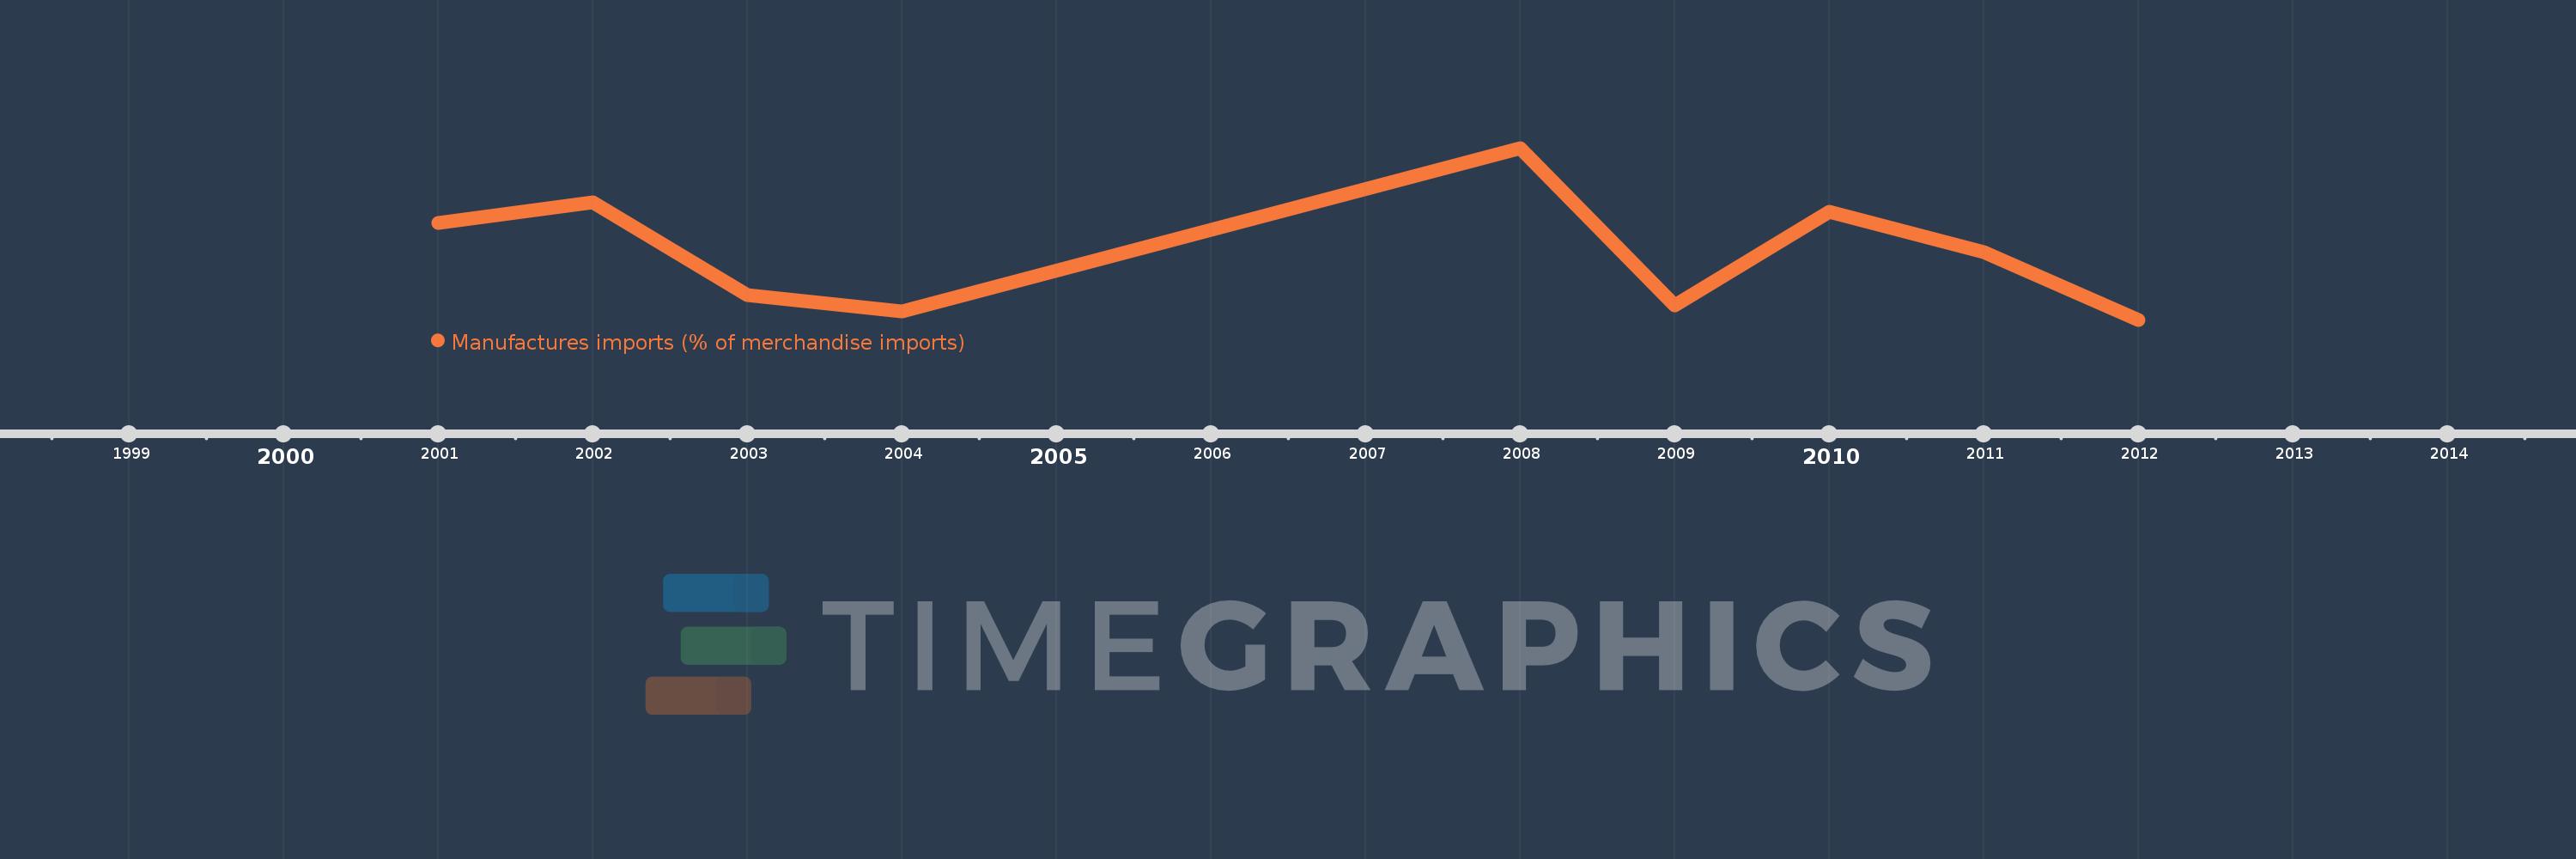
This timeline shows a graph from 2001 to 2012 of Least developed countries: UN classification. No data until 2000. Number of actual observations by date: 9.
Source name:
World Development Indicators
Source organization:
World Bank staff estimates from the Comtrade database maintained by the United Nations Statistics Division.
Categories, topics:
Private Sector, Trade
Last updated:
apr 23, 2017
Indicators value changes by year
Meaning:
61.296
Minimum:
58.915
jan 1, 2012
Maximum:
64.958
jan 1, 2008
At the date of observation
Value
Absolute change
Change from the previous value
jan 1, 2001
62.333
+62.333
0.0%
jan 1, 2002
63.041
+0.707
1.13%
jan 1, 2003
59.794
-3.247
-5.15%
jan 1, 2004
59.199
-0.595
-0.99%
jan 1, 2008
64.958
+5.759
9.73%
jan 1, 2009
59.413
-5.545
-8.54%
jan 1, 2010
62.723
+3.31
5.57%
jan 1, 2011
61.292
-1.431
-2.28%
jan 1, 2012
58.915
-2.377
-3.88%
Ranking of countries by current statistics by years