33
/
AIzaSyB4mHJ5NPEv-XzF7P6NDYXjlkCWaeKw5bc
November 30, 2025
190492
Mali
MLI
true
2
1
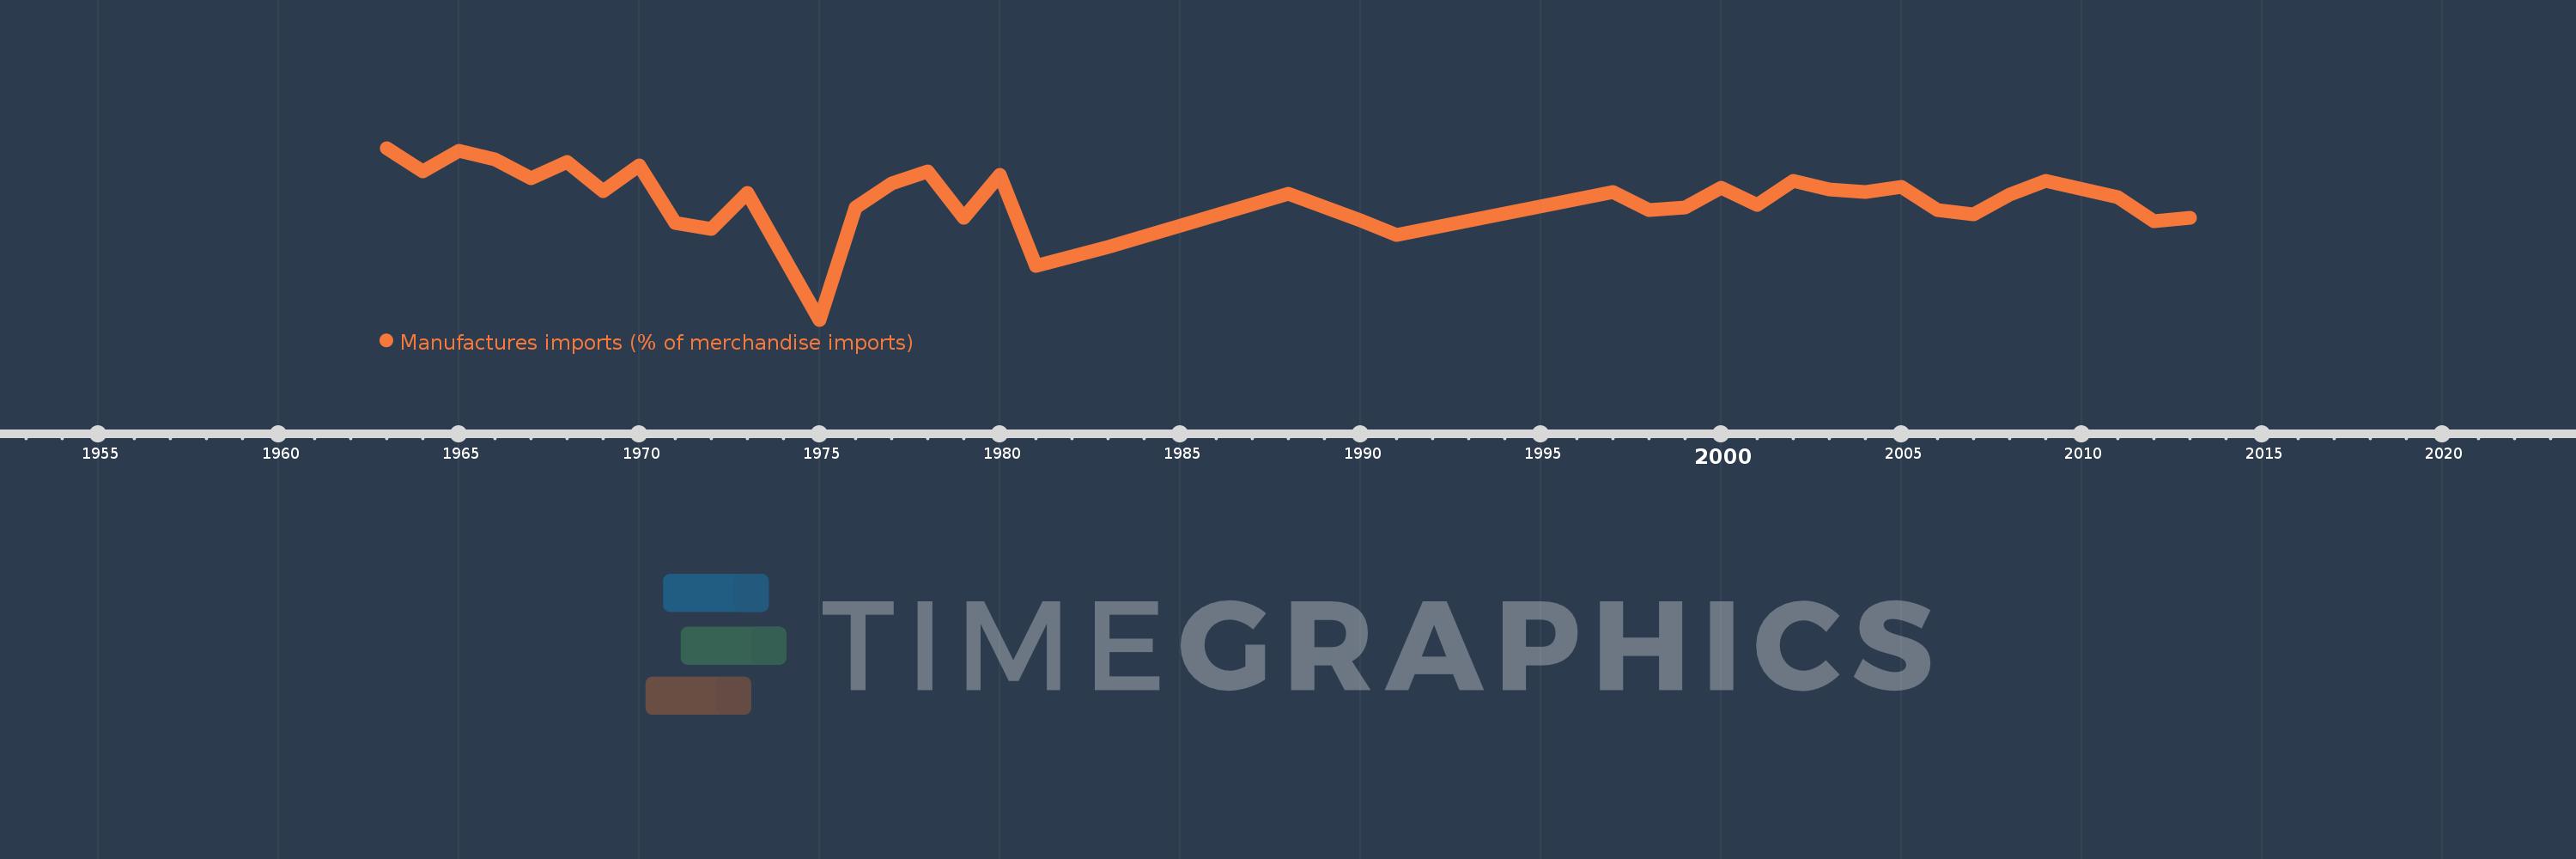
Manufactures imports (% of merchandise imports)
2013,2012,2011,2009,2008,2007,2006,2005,2004,2003,2002,2001,2000,1999,1998,1997,1991,1990,1988,1983,1981,1980,1979,1978,1977,1976,1975,1973,1972,1971,1970,1969,1968,1967,1966,1965,1964,1963