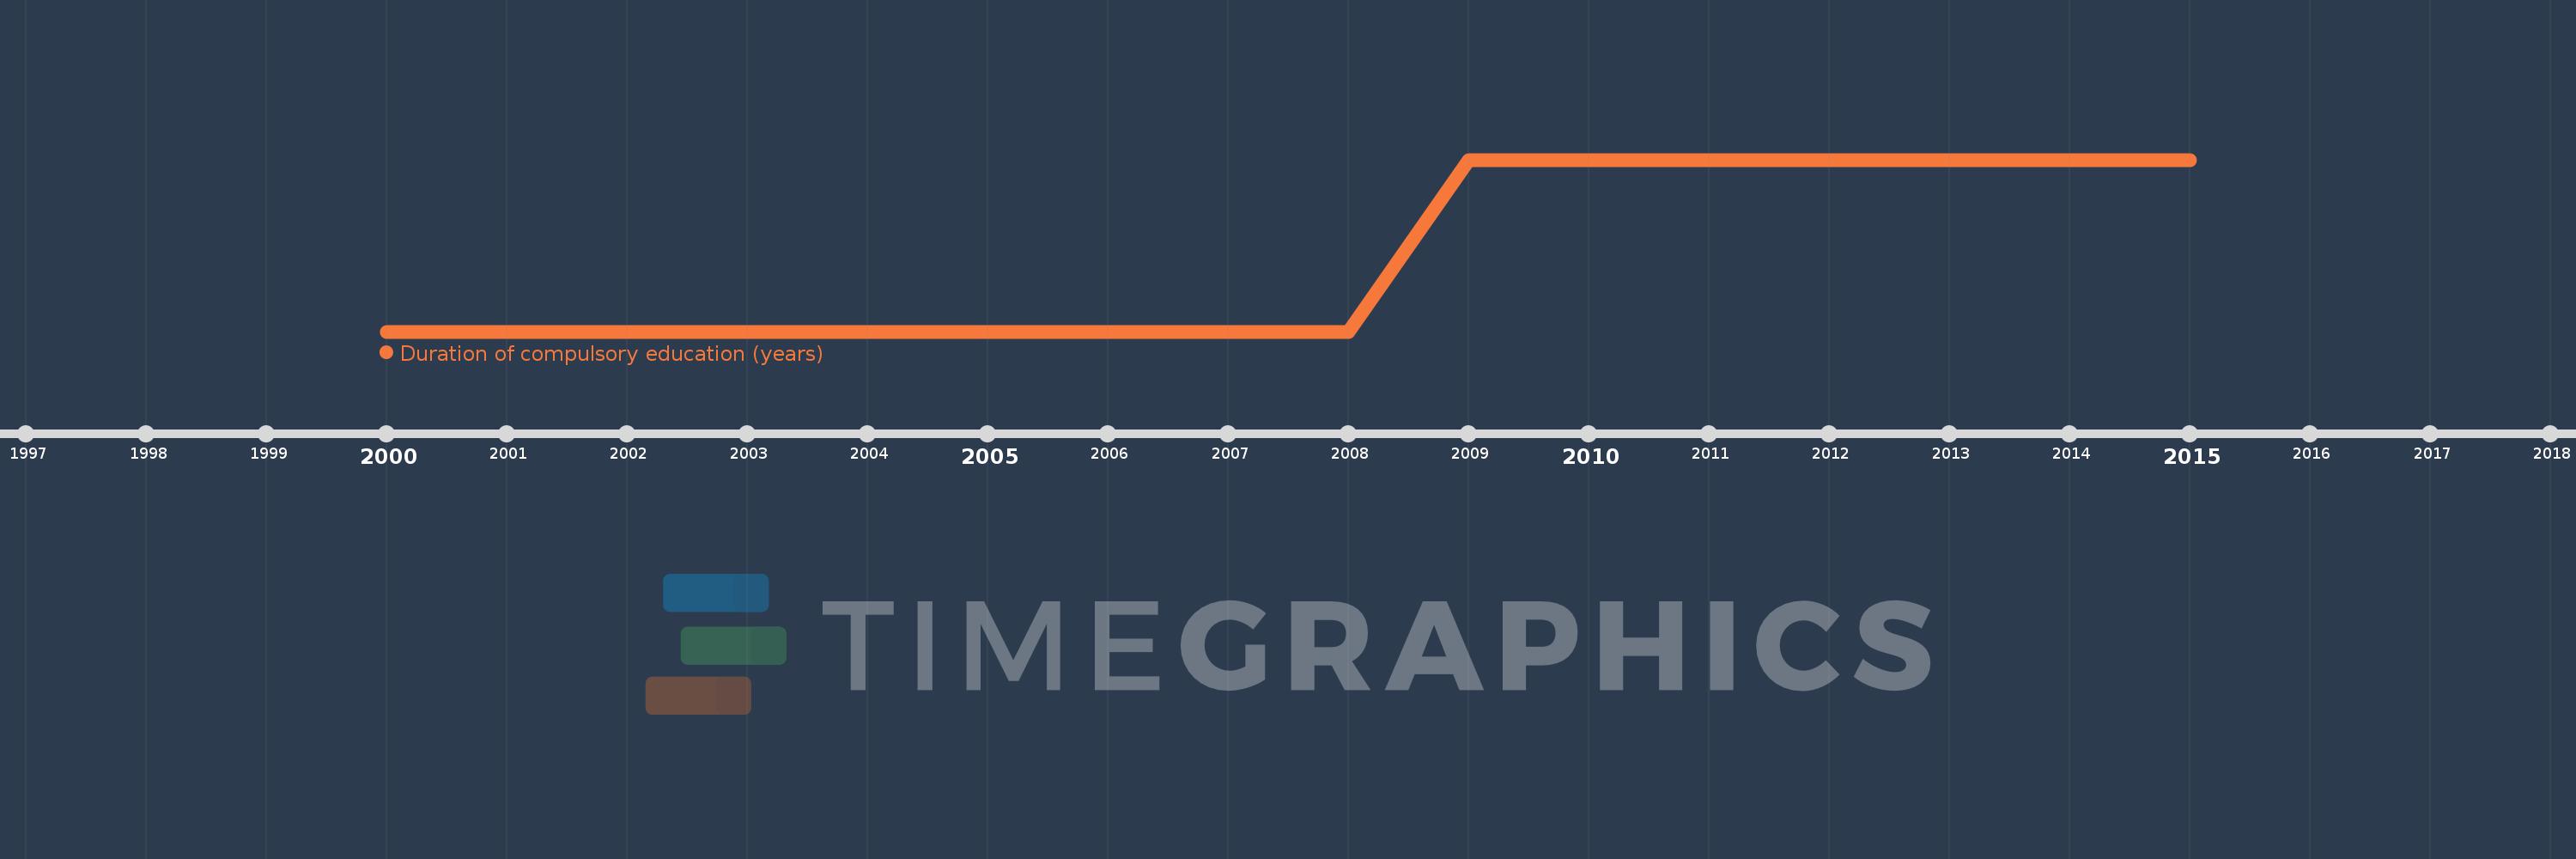
This timeline shows a graph from 2000 to 2015 of Least developed countries: UN classification. No data until 1999. Number of actual observations by date: 16.
Source name:
World Development Indicators
Source organization:
UNESCO Institute for Statistics
Categories, topics:
Education
Last updated:
apr 23, 2017
Indicators value changes by year
Meaning:
6.438
Minimum:
6.0
jan 1, 2000
Maximum:
7.0
jan 1, 2009
At the date of observation
Value
Absolute change
Change from the previous value
jan 1, 2000
6.0
+6.0
0.0%
jan 1, 2001
6.0
0.0
0.0%
jan 1, 2002
6.0
0.0
0.0%
jan 1, 2003
6.0
0.0
0.0%
jan 1, 2004
6.0
0.0
0.0%
jan 1, 2005
6.0
0.0
0.0%
jan 1, 2006
6.0
0.0
0.0%
jan 1, 2007
6.0
0.0
0.0%
jan 1, 2008
6.0
0.0
0.0%
jan 1, 2009
7.0
+1.0
16.67%
jan 1, 2010
7.0
0.0
0.0%
jan 1, 2011
7.0
0.0
0.0%
jan 1, 2012
7.0
0.0
0.0%
jan 1, 2013
7.0
0.0
0.0%
jan 1, 2014
7.0
0.0
0.0%
jan 1, 2015
7.0
0.0
0.0%
Ranking of countries by current statistics by years