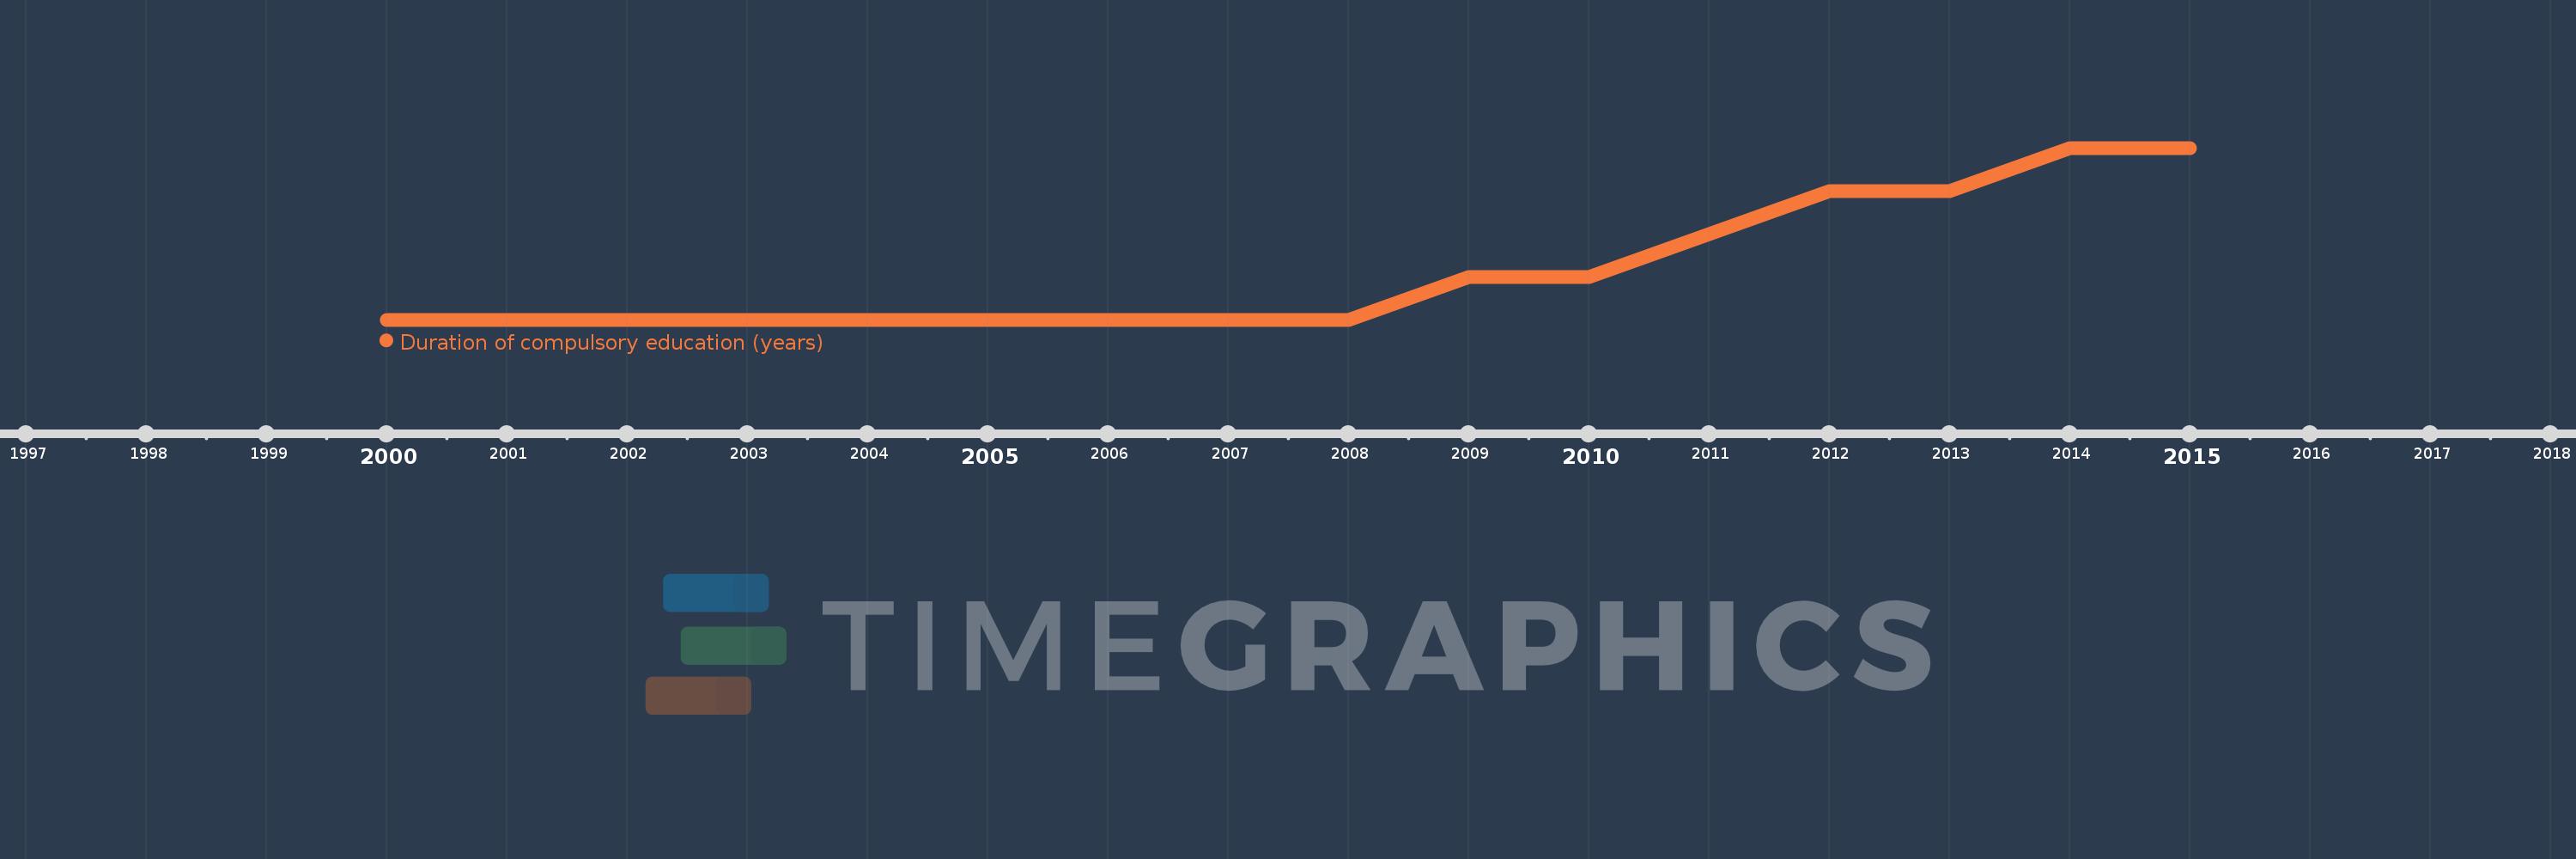
This timeline shows a graph from 2000 to 2015 of Latin America & the Caribbean (IDA & IBRD countries). No data until 1999. Number of actual observations by date: 16.
Source name:
World Development Indicators
Source organization:
UNESCO Institute for Statistics
Categories, topics:
Education
Last updated:
apr 23, 2017
Indicators value changes by year
Meaning:
10.125
Minimum:
9.0
jan 1, 2000
Maximum:
13.0
jan 1, 2014
At the date of observation
Value
Absolute change
Change from the previous value
jan 1, 2000
9.0
+9.0
0.0%
jan 1, 2001
9.0
0.0
0.0%
jan 1, 2002
9.0
0.0
0.0%
jan 1, 2003
9.0
0.0
0.0%
jan 1, 2004
9.0
0.0
0.0%
jan 1, 2005
9.0
0.0
0.0%
jan 1, 2006
9.0
0.0
0.0%
jan 1, 2007
9.0
0.0
0.0%
jan 1, 2008
9.0
0.0
0.0%
jan 1, 2009
10.0
+1.0
11.11%
jan 1, 2010
10.0
0.0
0.0%
jan 1, 2011
11.0
+1.0
10.0%
jan 1, 2012
12.0
+1.0
9.09%
jan 1, 2013
12.0
0.0
0.0%
jan 1, 2014
13.0
+1.0
8.33%
jan 1, 2015
13.0
0.0
0.0%
Ranking of countries by current statistics by years