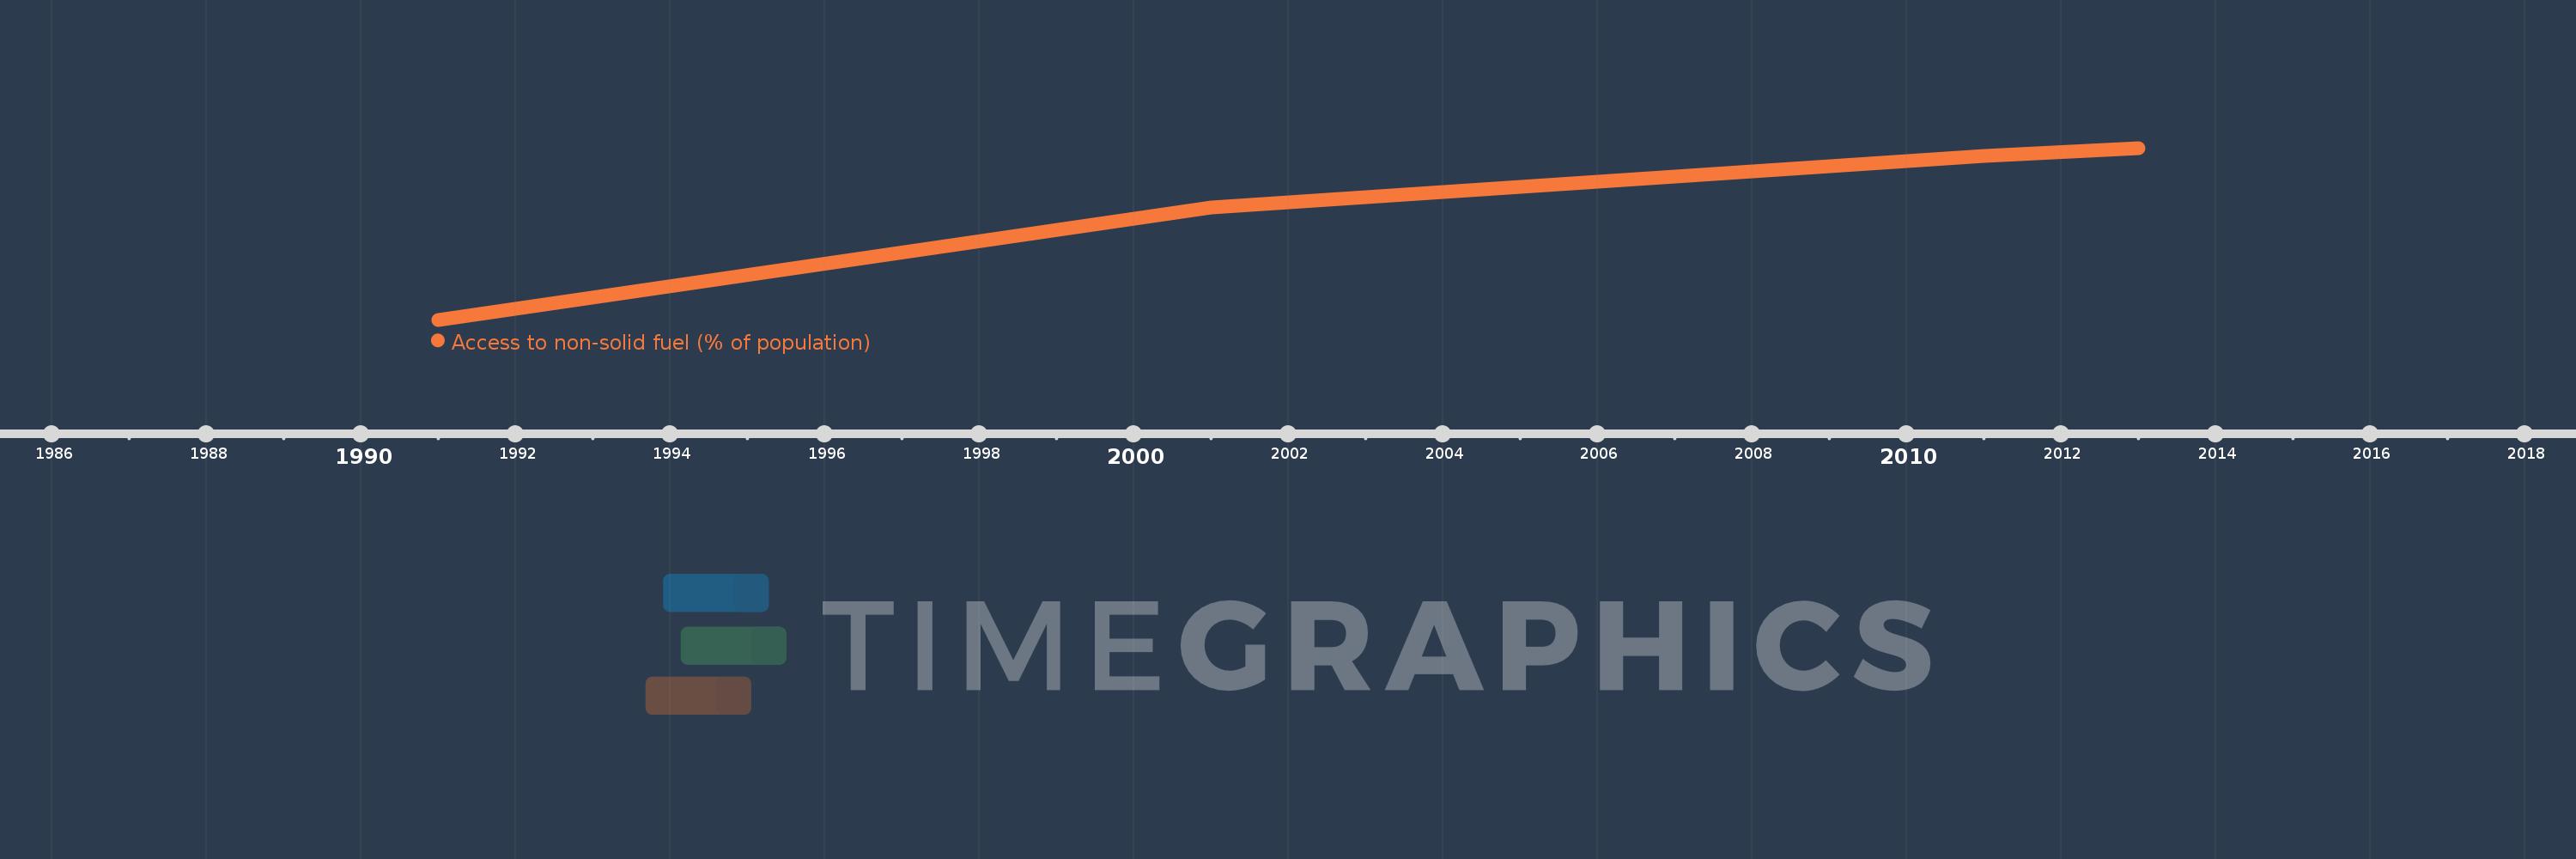
This timeline shows a graph from 1991 to 2013 of Least developed countries: UN classification. No data until 1990. Number of actual observations by date: 4.
Source name:
World Development Indicators
Source organization:
World Bank, Sustainable Energy for all (SE4ALL) database from WHO Global Household Energy database.
Categories, topics:
Energy & Mining, Environment
Last updated:
apr 23, 2017
Indicators value changes by year
Meaning:
9.625
Minimum:
6.127
jan 1, 1991
Maximum:
11.496
jan 1, 2013
At the date of observation
Value
Absolute change
Change from the previous value
jan 1, 1991
6.127
+6.127
0.0%
jan 1, 2001
9.639
+3.512
57.32%
jan 1, 2011
11.24
+1.601
16.61%
jan 1, 2013
11.496
+0.256
2.28%
Ranking of countries by current statistics by years