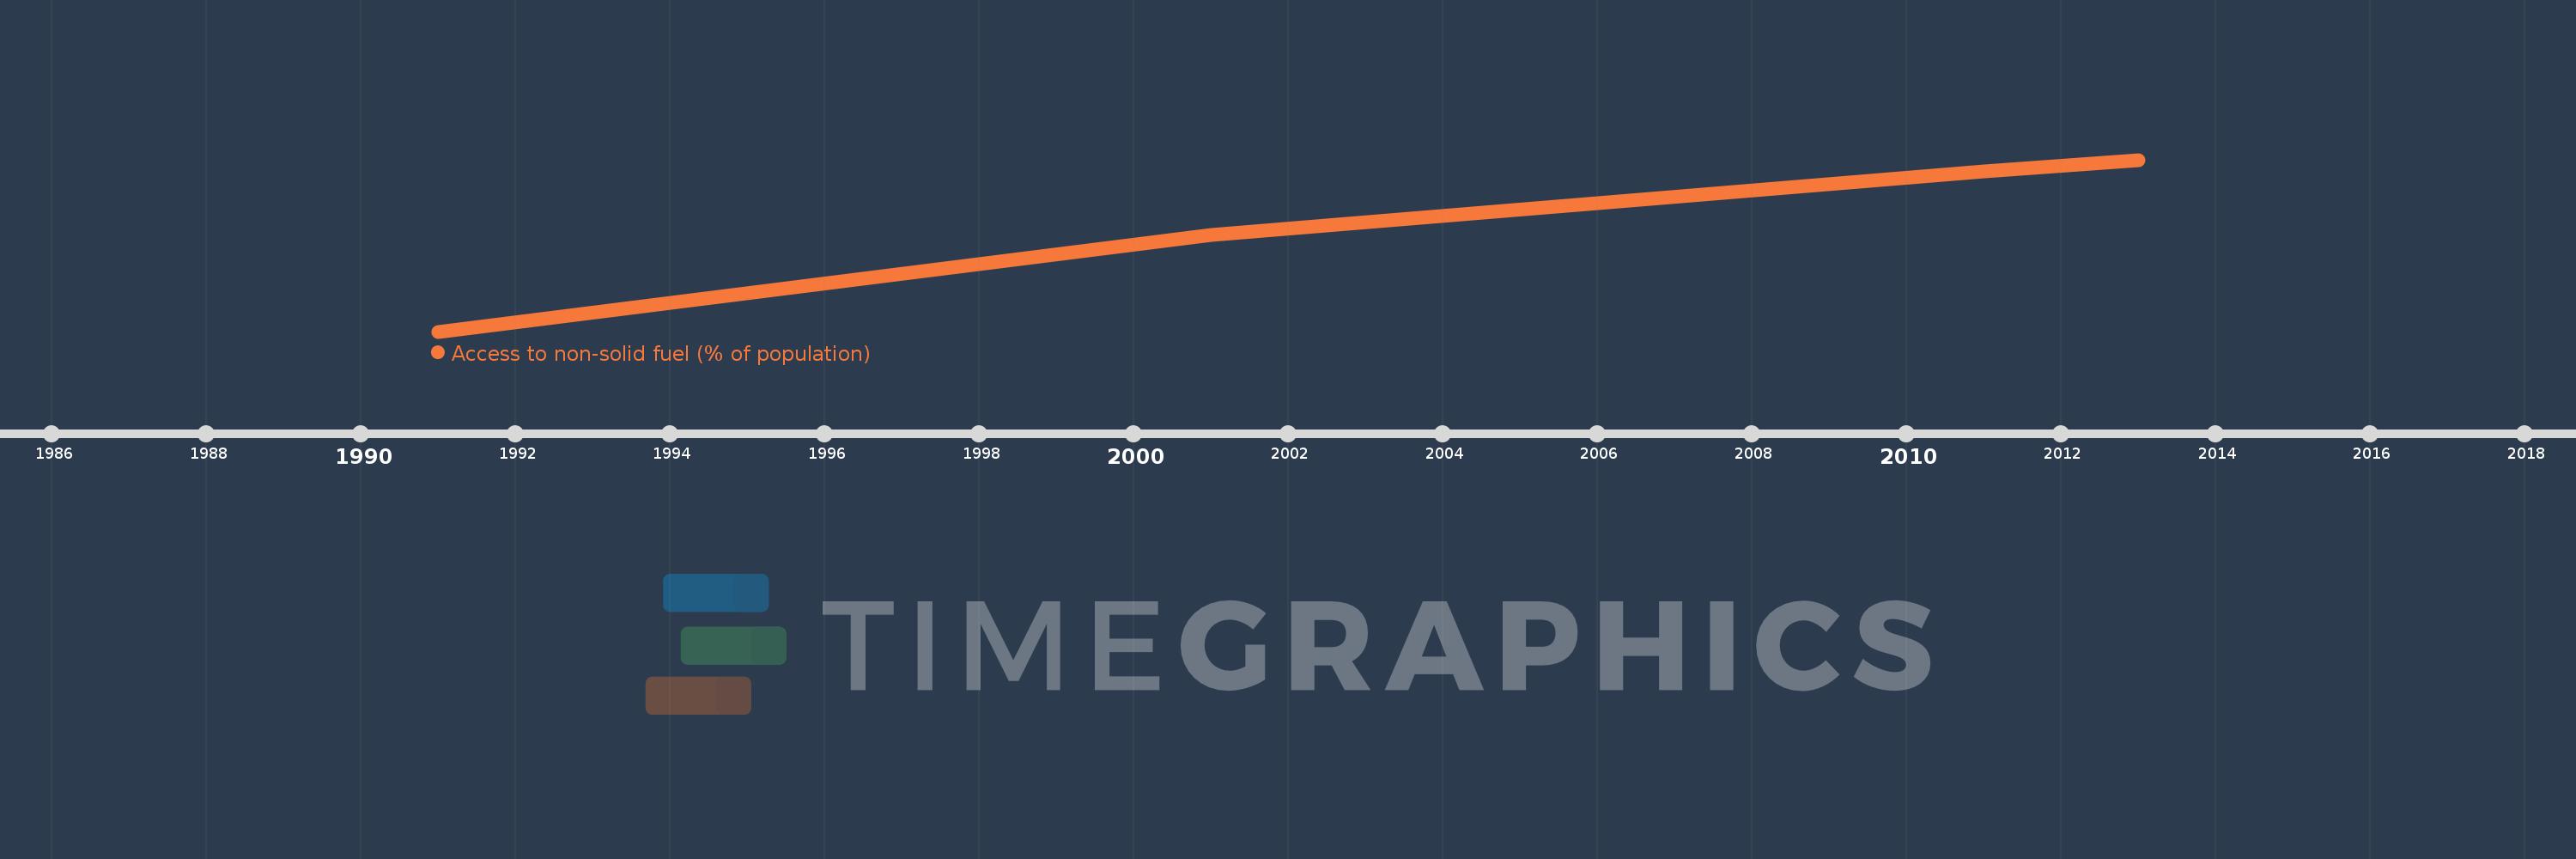
This timeline shows a graph from 1991 to 2013 of East Asia & Pacific (excluding high income). No data until 1990. Number of actual observations by date: 4.
Source name:
World Development Indicators
Source organization:
World Bank, Sustainable Energy for all (SE4ALL) database from WHO Global Household Energy database.
Categories, topics:
Energy & Mining, Environment
Last updated:
apr 23, 2017
Indicators value changes by year
Meaning:
45.376
Minimum:
31.568
jan 1, 1991
Maximum:
53.692
jan 1, 2013
At the date of observation
Value
Absolute change
Change from the previous value
jan 1, 1991
31.568
+31.568
0.0%
jan 1, 2001
44.054
+12.486
39.55%
jan 1, 2011
52.19
+8.136
18.47%
jan 1, 2013
53.692
+1.502
2.88%
Ranking of countries by current statistics by years