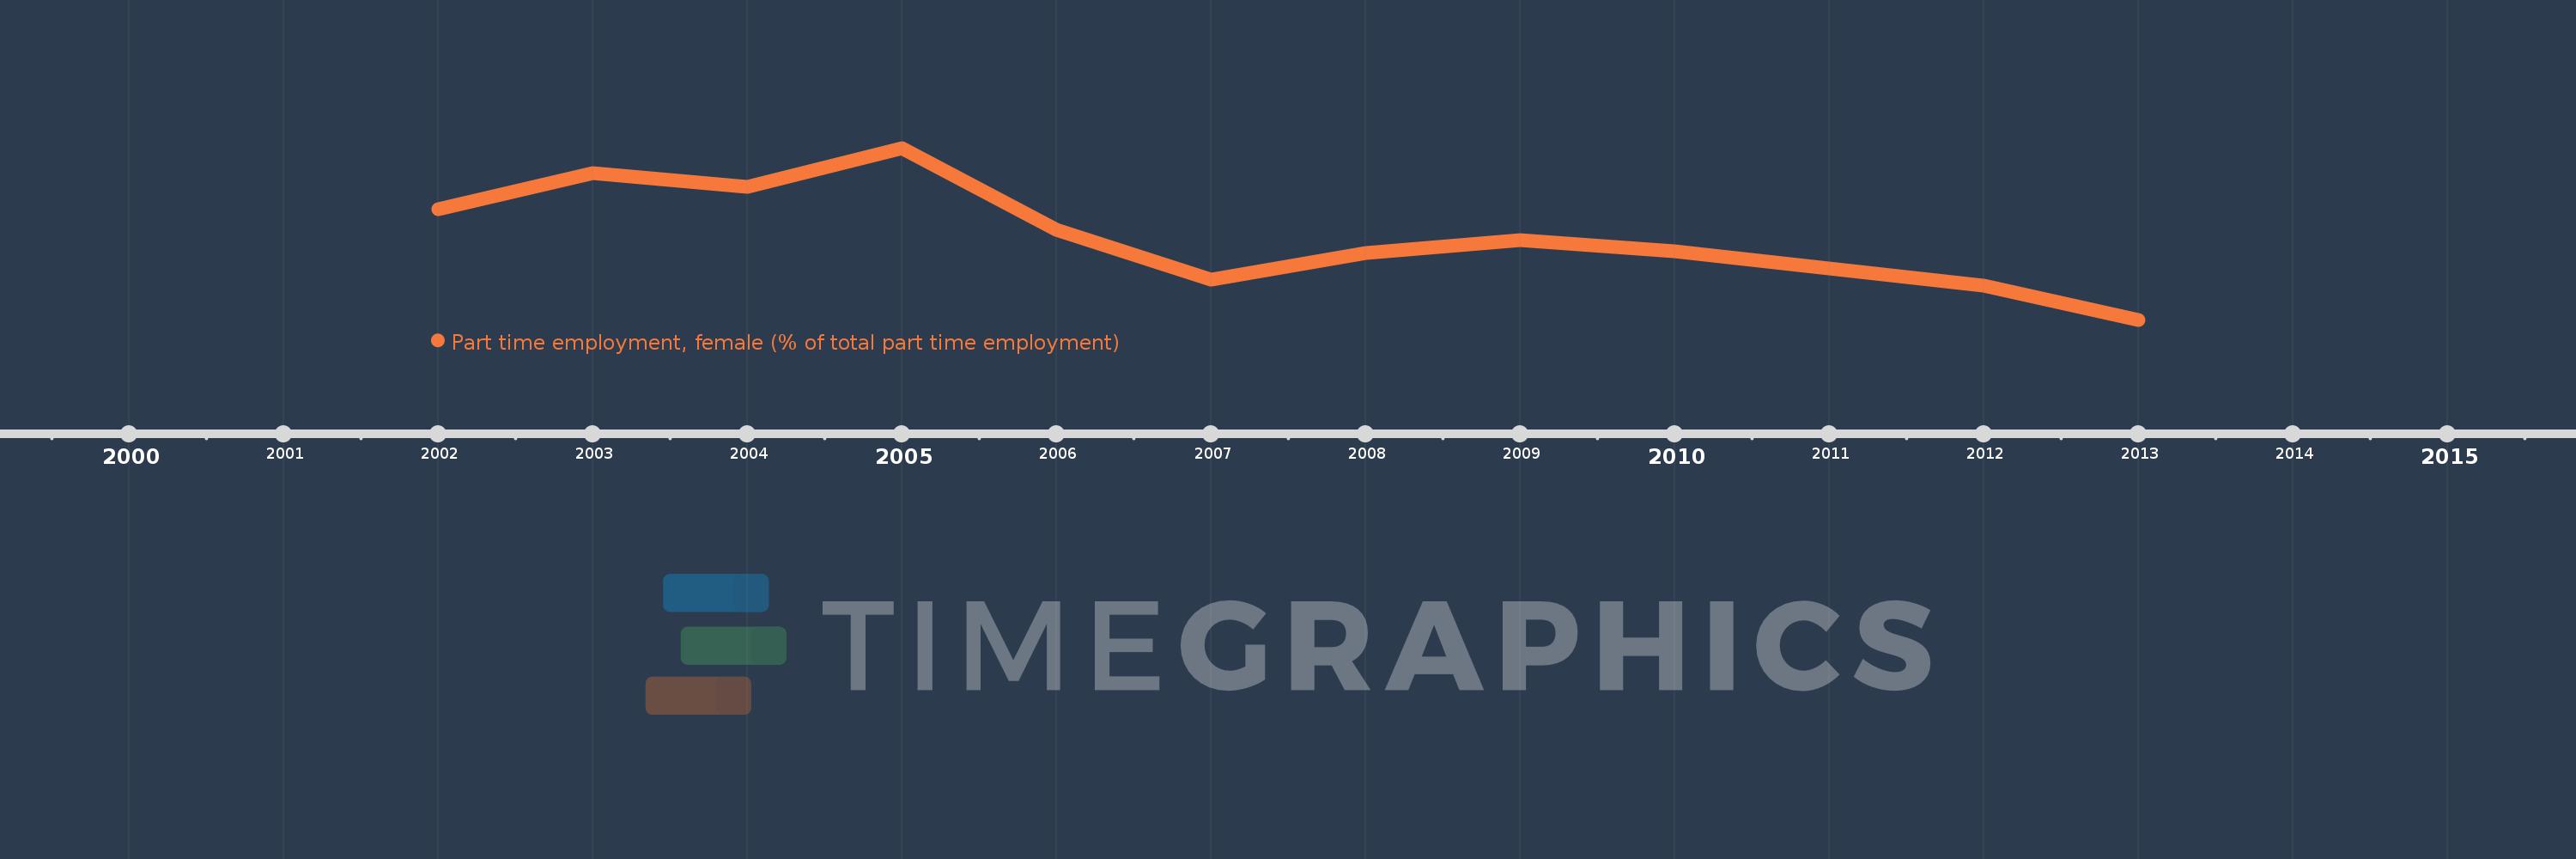
This timeline shows a graph from 2002 to 2013 of Latin America & the Caribbean (IDA & IBRD countries). No data until 2001. Number of actual observations by date: 11.
Source name:
World Development Indicators
Source organization:
International Labour Organization, Key Indicators of the Labour Market database.
Categories, topics:
Social Protection & Labor, Gender
Last updated:
apr 23, 2017
Indicators value changes by year
Meaning:
63.498
Minimum:
62.068
jan 1, 2013
Maximum:
64.941
jan 1, 2005
At the date of observation
Value
Absolute change
Change from the previous value
jan 1, 2002
63.915
+63.915
0.0%
jan 1, 2003
64.521
+0.606
0.95%
jan 1, 2004
64.287
-0.233
-0.36%
jan 1, 2005
64.941
+0.654
1.02%
jan 1, 2006
63.577
-1.363
-2.1%
jan 1, 2007
62.737
-0.84
-1.32%
jan 1, 2008
63.179
+0.442
0.7%
jan 1, 2009
63.405
+0.226
0.36%
jan 1, 2010
63.211
-0.195
-0.31%
jan 1, 2012
62.641
-0.57
-0.9%
jan 1, 2013
62.068
-0.573
-0.91%
Ranking of countries by current statistics by years