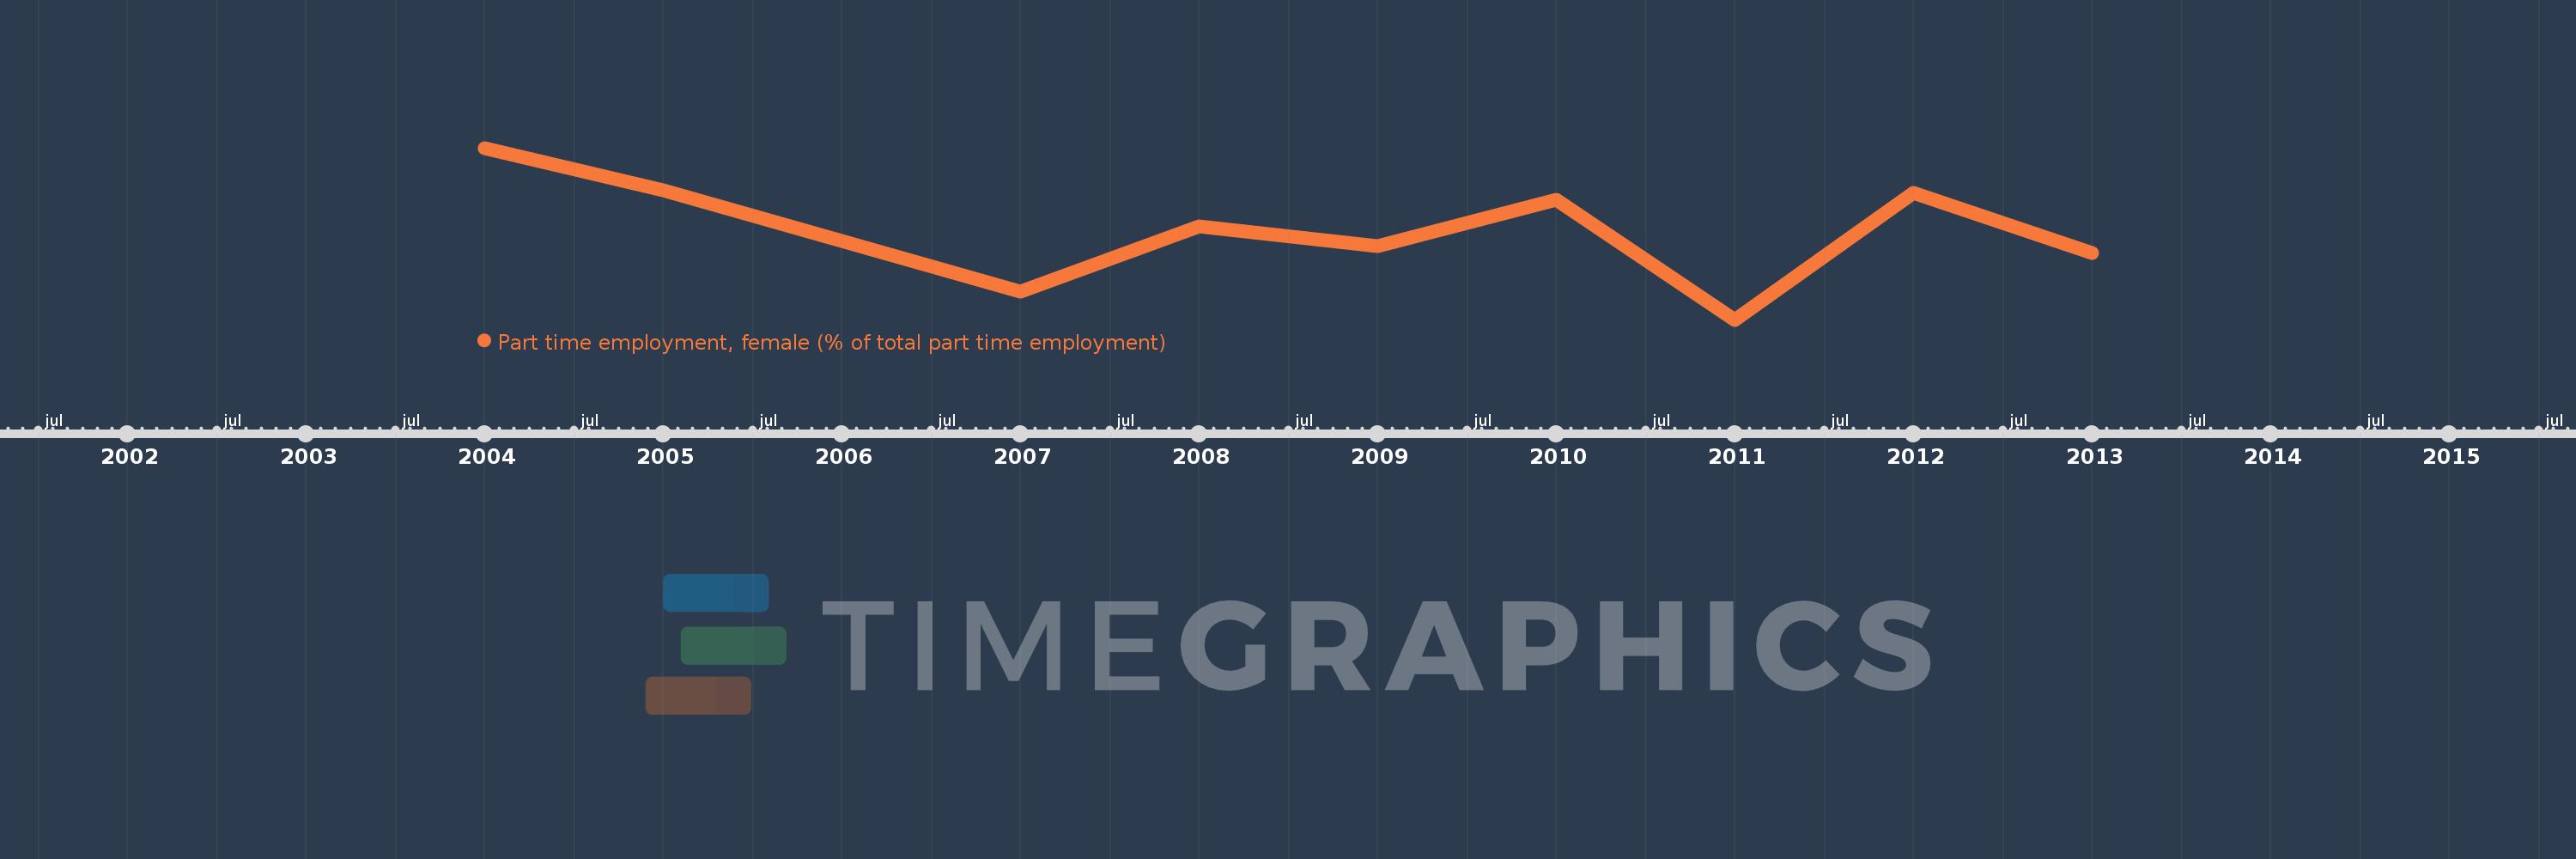
This timeline shows a graph from 2004 to 2013 of Europe & Central Asia (IDA & IBRD countries). No data until 2003. Number of actual observations by date: 9.
Source name:
World Development Indicators
Source organization:
International Labour Organization, Key Indicators of the Labour Market database.
Categories, topics:
Social Protection & Labor, Gender
Last updated:
apr 23, 2017
Indicators value changes by year
Meaning:
62.697
Minimum:
61.907
jan 1, 2011
Maximum:
63.416
jan 1, 2004
At the date of observation
Value
Absolute change
Change from the previous value
jan 1, 2004
63.416
+63.416
0.0%
jan 1, 2005
63.046
-0.37
-0.58%
jan 1, 2007
62.151
-0.894
-1.42%
jan 1, 2008
62.729
+0.578
0.93%
jan 1, 2009
62.555
-0.174
-0.28%
jan 1, 2010
62.959
+0.404
0.65%
jan 1, 2011
61.907
-1.052
-1.67%
jan 1, 2012
63.02
+1.113
1.8%
jan 1, 2013
62.491
-0.529
-0.84%
Ranking of countries by current statistics by years