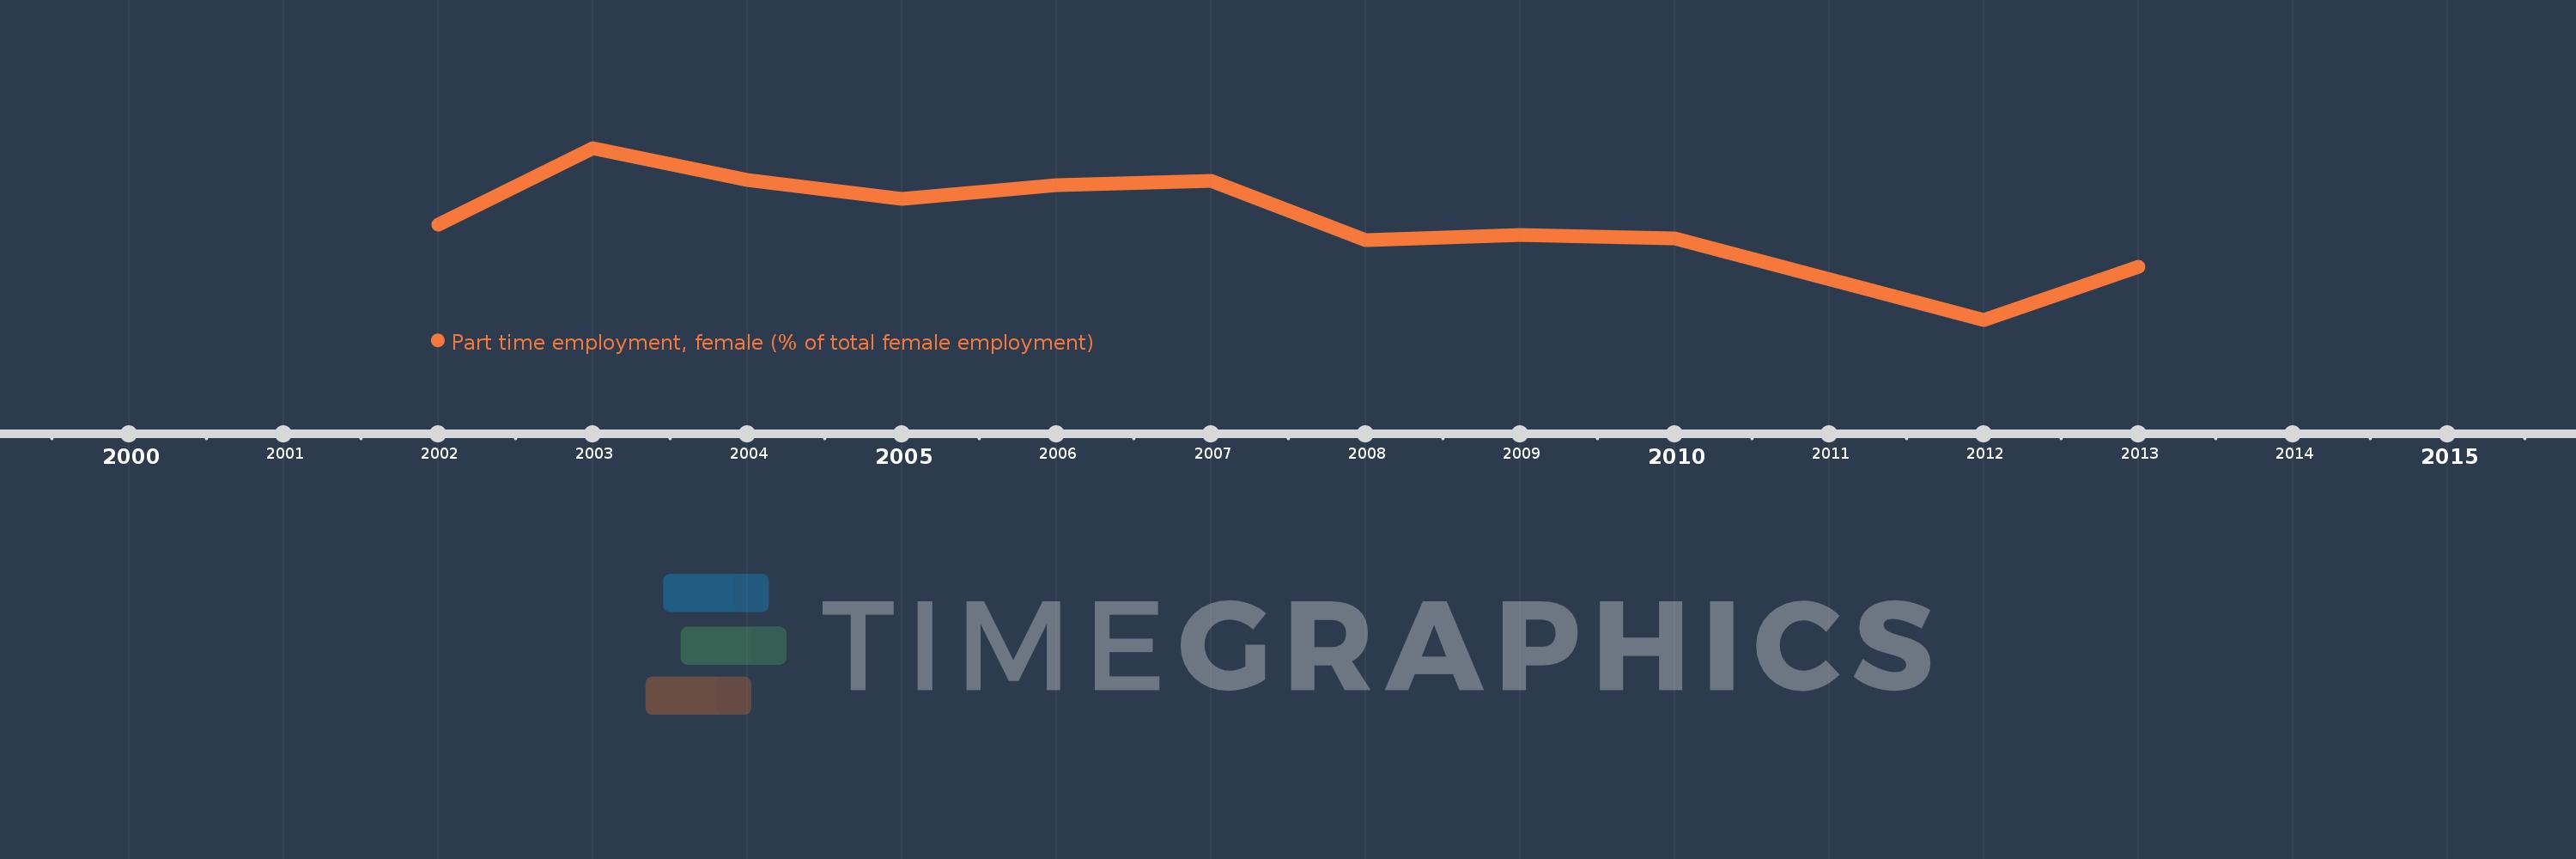
This timeline shows a graph from 2002 to 2013 of Latin America & the Caribbean (IDA & IBRD countries). No data until 2001. Number of actual observations by date: 11.
Source name:
World Development Indicators
Source organization:
International Labour Organization, Key Indicators of the Labour Market database.
Categories, topics:
Social Protection & Labor, Gender
Last updated:
apr 23, 2017
Indicators value changes by year
Meaning:
27.775
Minimum:
25.43
jan 1, 2012
Maximum:
29.46
jan 1, 2003
At the date of observation
Value
Absolute change
Change from the previous value
jan 1, 2002
27.658
+27.658
0.0%
jan 1, 2003
29.46
+1.802
6.51%
jan 1, 2004
28.716
-0.744
-2.53%
jan 1, 2005
28.259
-0.457
-1.59%
jan 1, 2006
28.593
+0.333
1.18%
jan 1, 2007
28.682
+0.089
0.31%
jan 1, 2008
27.288
-1.395
-4.86%
jan 1, 2009
27.425
+0.137
0.5%
jan 1, 2010
27.33
-0.095
-0.35%
jan 1, 2012
25.43
-1.9
-6.95%
jan 1, 2013
26.681
+1.252
4.92%
Ranking of countries by current statistics by years