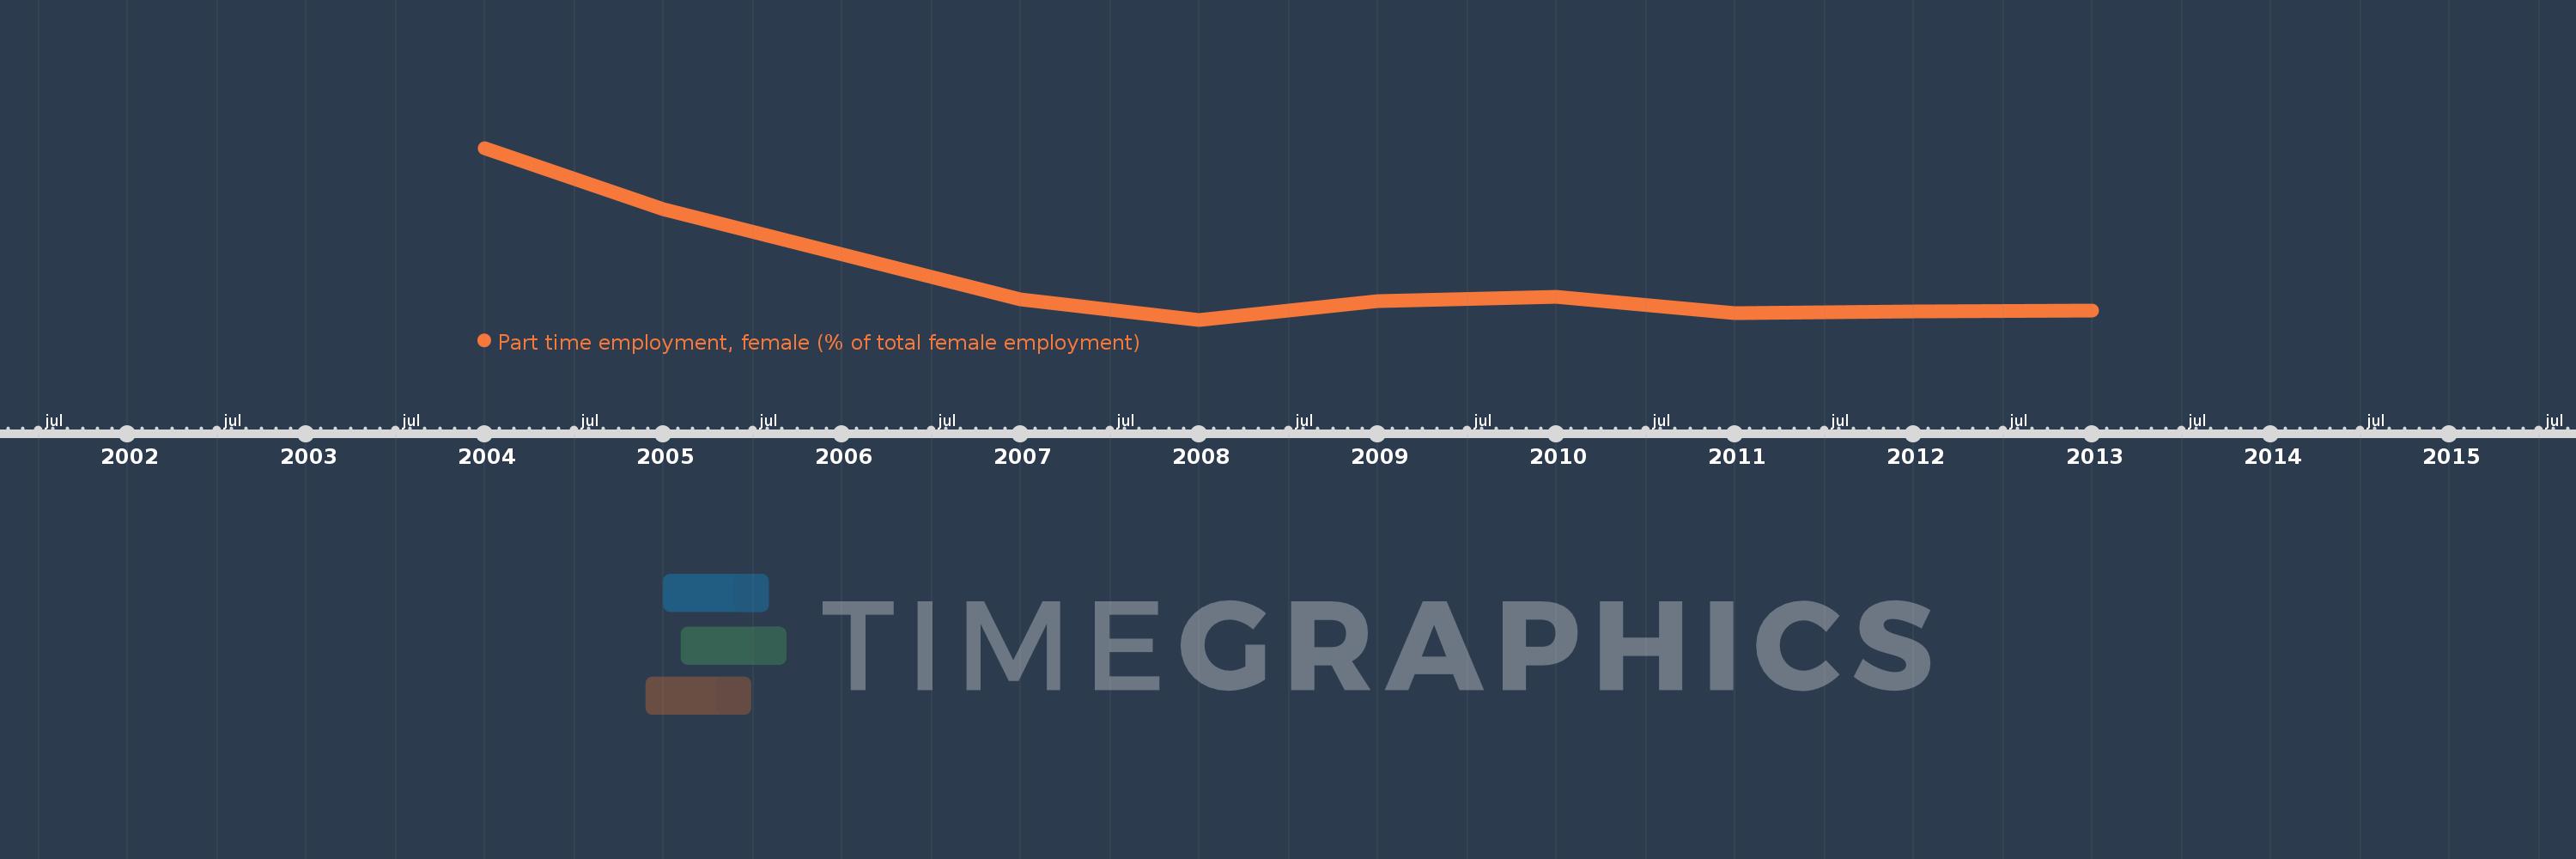
This timeline shows a graph from 2004 to 2013 of Europe & Central Asia (IDA & IBRD countries). No data until 2003. Number of actual observations by date: 9.
Source name:
World Development Indicators
Source organization:
International Labour Organization, Key Indicators of the Labour Market database.
Categories, topics:
Social Protection & Labor, Gender
Last updated:
apr 23, 2017
Indicators value changes by year
Meaning:
9.652
Minimum:
9.267
jan 1, 2008
Maximum:
10.881
jan 1, 2004
At the date of observation
Value
Absolute change
Change from the previous value
jan 1, 2004
10.881
+10.881
0.0%
jan 1, 2005
10.303
-0.579
-5.32%
jan 1, 2007
9.461
-0.842
-8.17%
jan 1, 2008
9.267
-0.194
-2.05%
jan 1, 2009
9.44
+0.174
1.87%
jan 1, 2010
9.482
+0.041
0.44%
jan 1, 2011
9.333
-0.148
-1.56%
jan 1, 2012
9.348
+0.015
0.16%
jan 1, 2013
9.356
+0.008
0.08%
Ranking of countries by current statistics by years