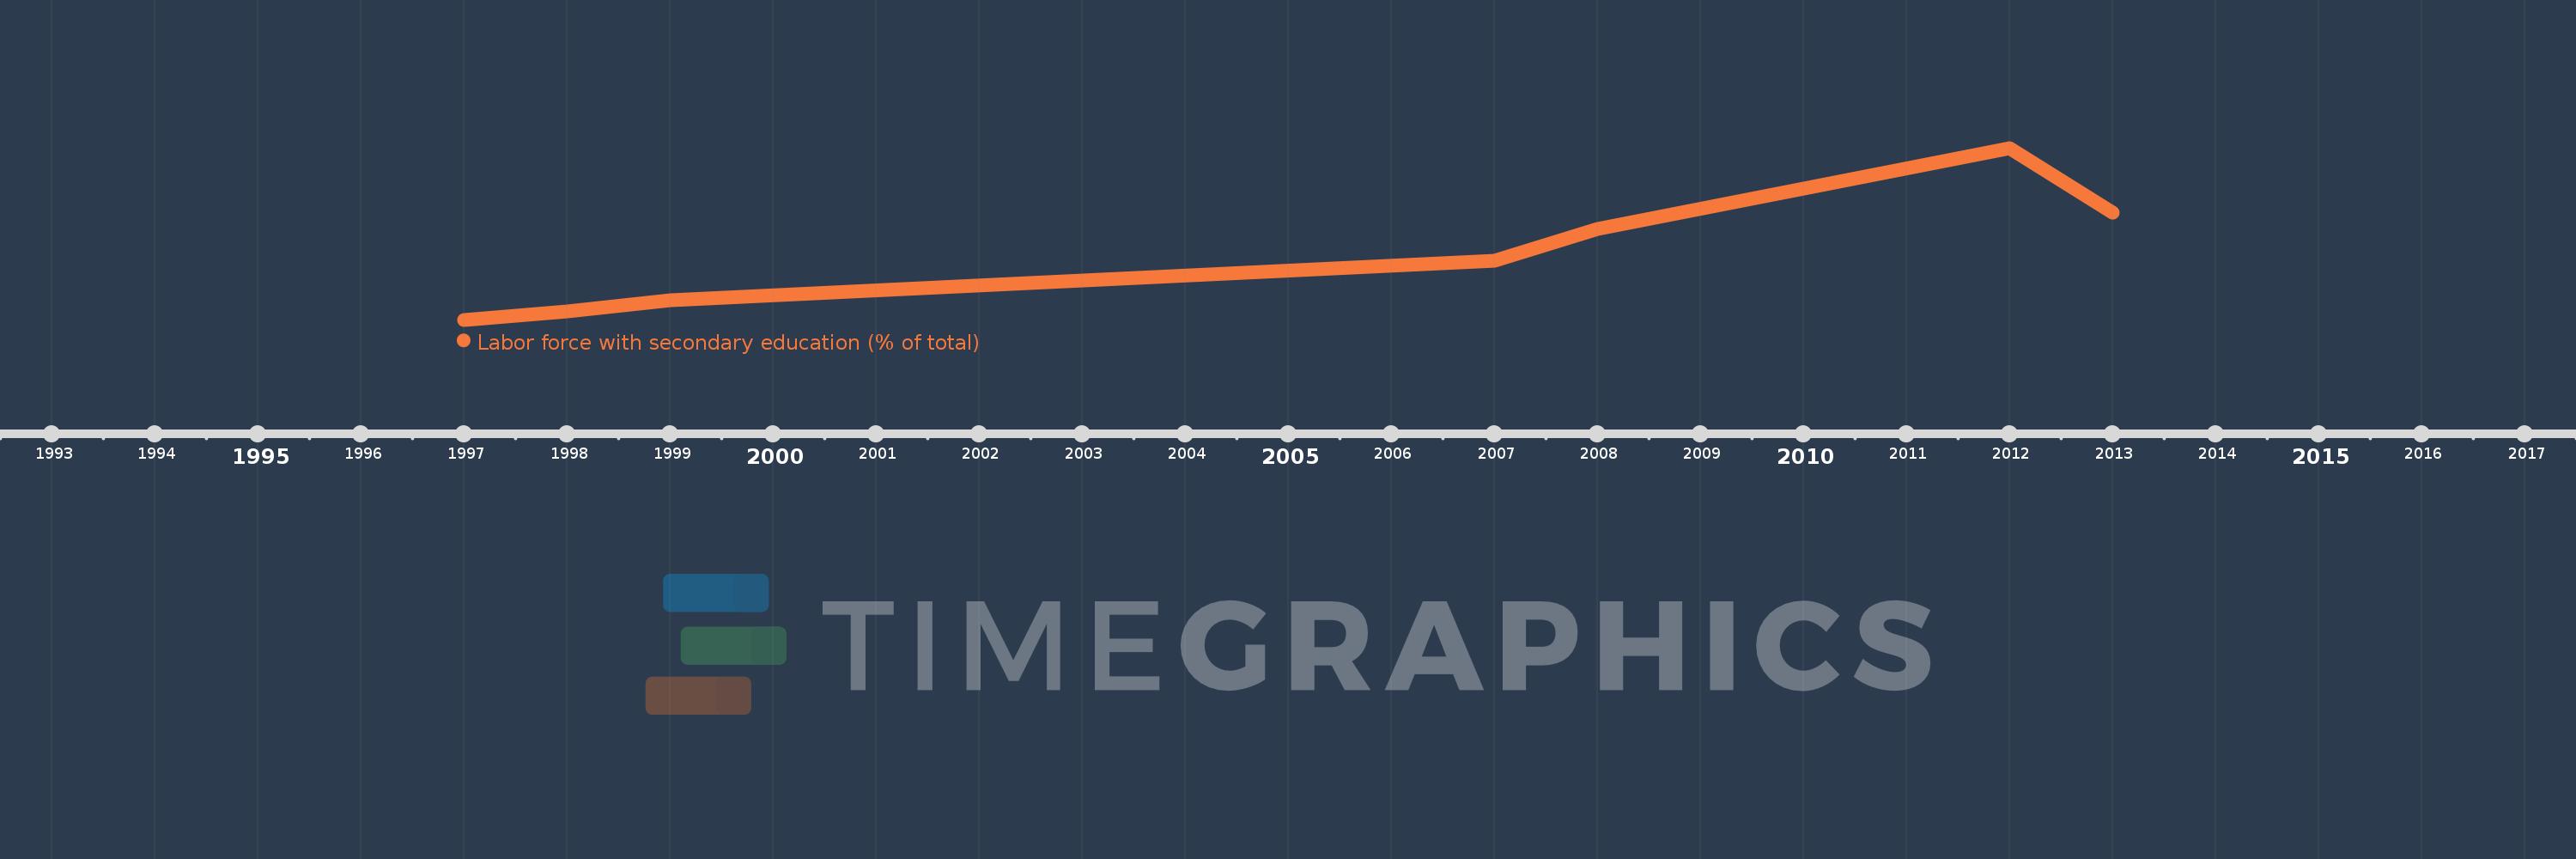
This timeline shows a graph from 1997 to 2013 of Latin America & the Caribbean (IDA & IBRD countries). No data until 1996. Number of actual observations by date: 7.
Source name:
World Development Indicators
Source organization:
International Labour Organization, Key Indicators of the Labour Market database.
Categories, topics:
Education, Social Protection & Labor
Last updated:
apr 23, 2017
Indicators value changes by year
Meaning:
28.96
Minimum:
22.048
jan 1, 1997
Maximum:
40.258
jan 1, 2012
At the date of observation
Value
Absolute change
Change from the previous value
jan 1, 1997
22.048
+22.048
0.0%
jan 1, 1998
22.958
+0.909
4.12%
jan 1, 1999
24.083
+1.126
4.9%
jan 1, 2007
28.293
+4.209
17.48%
jan 1, 2008
31.669
+3.377
11.93%
jan 1, 2012
40.258
+8.589
27.12%
jan 1, 2013
33.411
-6.847
-17.01%
Ranking of countries by current statistics by years