33
/
AIzaSyAYiBZKx7MnpbEhh9jyipgxe19OcubqV5w
August 1, 2025
32757
Europe & Central Asia (IDA & IBRD countries)
TEC
false
2
1
Labor force with secondary education (% of total)
2014,2013,2012,2011,2010,2009,2008,2007,2006,2005,2004,2003
Download
Global statistics library →Europe & Central Asia (IDA & IBRD countries) →

Labor force with secondary education (% of total)

This statistics in other country:

AlbaniaAlgeriaAntigua and BarbudaArgentinaArmeniaArubaAustraliaAustriaAzerbaijanBahamas, TheBahrainBarbadosBelarusBelgiumBelizeBermudaBoliviaBosnia and HerzegovinaBotswanaBrazilBritish Virgin IslandsBulgariaCambodiaCanadaCayman IslandsCentral Europe and the BalticsChadChileColombiaCosta RicaCroatiaCubaCyprusCzech RepublicDenmarkDominicaDominican RepublicEarly-demographic dividendEcuadorEgypt, Arab Rep.El SalvadorEstoniaEthiopiaEuro areaEurope & Central AsiaEurope & Central Asia (excluding high income)Europe & Central Asia (IDA & IBRD countries)European UnionFinlandFranceFrench PolynesiaGeorgiaGermanyGhanaGreeceGuatemalaGuyanaHigh incomeHondurasHong Kong SAR, ChinaHungaryIcelandIndiaIndonesiaIran, Islamic Rep.IrelandIsraelItalyJapanJordanKazakhstanKorea, Rep.KosovoKuwaitKyrgyz RepublicLatin America & Caribbean Latin America & Caribbean (excluding high income)Latin America & the Caribbean (IDA & IBRD countries)LatviaLebanonLithuaniaLuxembourgMacao SAR, ChinaMacedonia, FYRMadagascarMalaysiaMaltaMauritiusMexicoMoldovaMongoliaMontenegroMoroccoNamibiaNepalNetherlandsNew CaledoniaNew ZealandNicaraguaNigerNigeriaNorth AmericaNorwayOECD membersOmanPakistanPanamaParaguayPeruPhilippinesPolandPortugalPost-demographic dividendRomaniaRussian FederationRwandaSan MarinoSaudi ArabiaSerbiaSingaporeSlovak RepublicSloveniaSouth AfricaSouth AsiaSouth Asia (IDA & IBRD)SpainSri LankaSt. Kitts and NevisSt. LuciaSt. Vincent and the GrenadinesSwedenSwitzerlandSyrian Arab RepublicTajikistanThailandTimor-LesteTrinidad and TobagoTunisiaTurkeyUgandaUkraineUnited Arab EmiratesUnited KingdomUnited StatesUruguayVenezuela, RBWest Bank and GazaYemen, Rep.

Timeline:

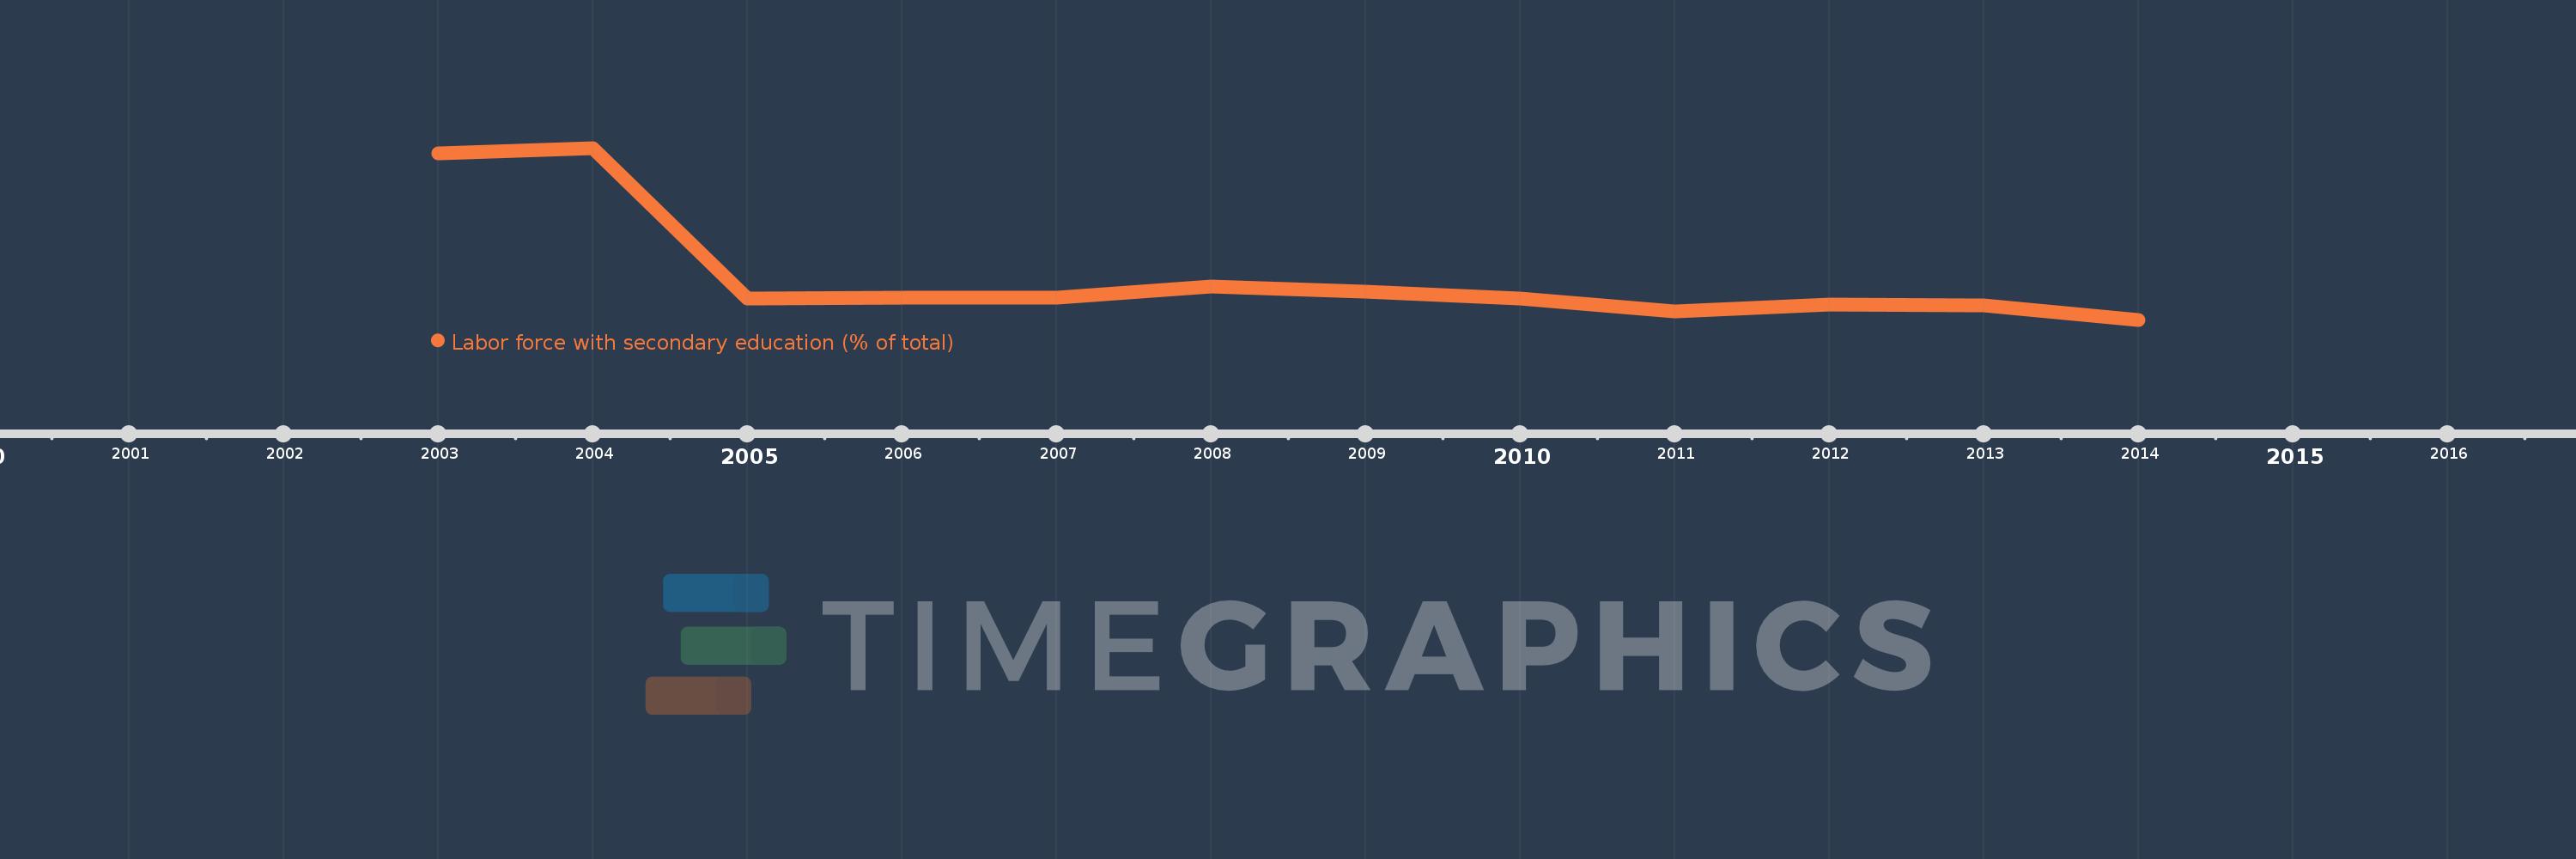
This timeline shows a graph from 2003 to 2014 of Europe & Central Asia (IDA & IBRD countries). No data until 2002. Number of actual observations by date: 12.

Source name:

World Development Indicators

Source organization:

International Labour Organization, Key Indicators of the Labour Market database.

Categories, topics:

Education, Social Protection & Labor

Last updated:

apr 23, 2017

Indicators value changes by year

Meaning:
46.435
Minimum:
42.676
jan 1, 2014
Maximum:
57.481
jan 1, 2004
At the date of observation
Value
Absolute change
Change from the previous value
jan 1, 2003
57.017
+57.017
0.0%
jan 1, 2004
57.481
+0.464
0.81%
jan 1, 2005
44.487
-12.994
-22.61%
jan 1, 2006
44.574
+0.087
0.2%
jan 1, 2007
44.569
-0.006
-0.01%
jan 1, 2008
45.542
+0.973
2.18%
jan 1, 2009
45.062
-0.48
-1.05%
jan 1, 2010
44.536
-0.526
-1.17%
jan 1, 2011
43.409
-1.127
-2.53%
jan 1, 2012
43.953
+0.545
1.25%
jan 1, 2013
43.908
-0.045
-0.1%
jan 1, 2014
42.676
-1.232
-2.81%

Ranking of countries by current statistics by years