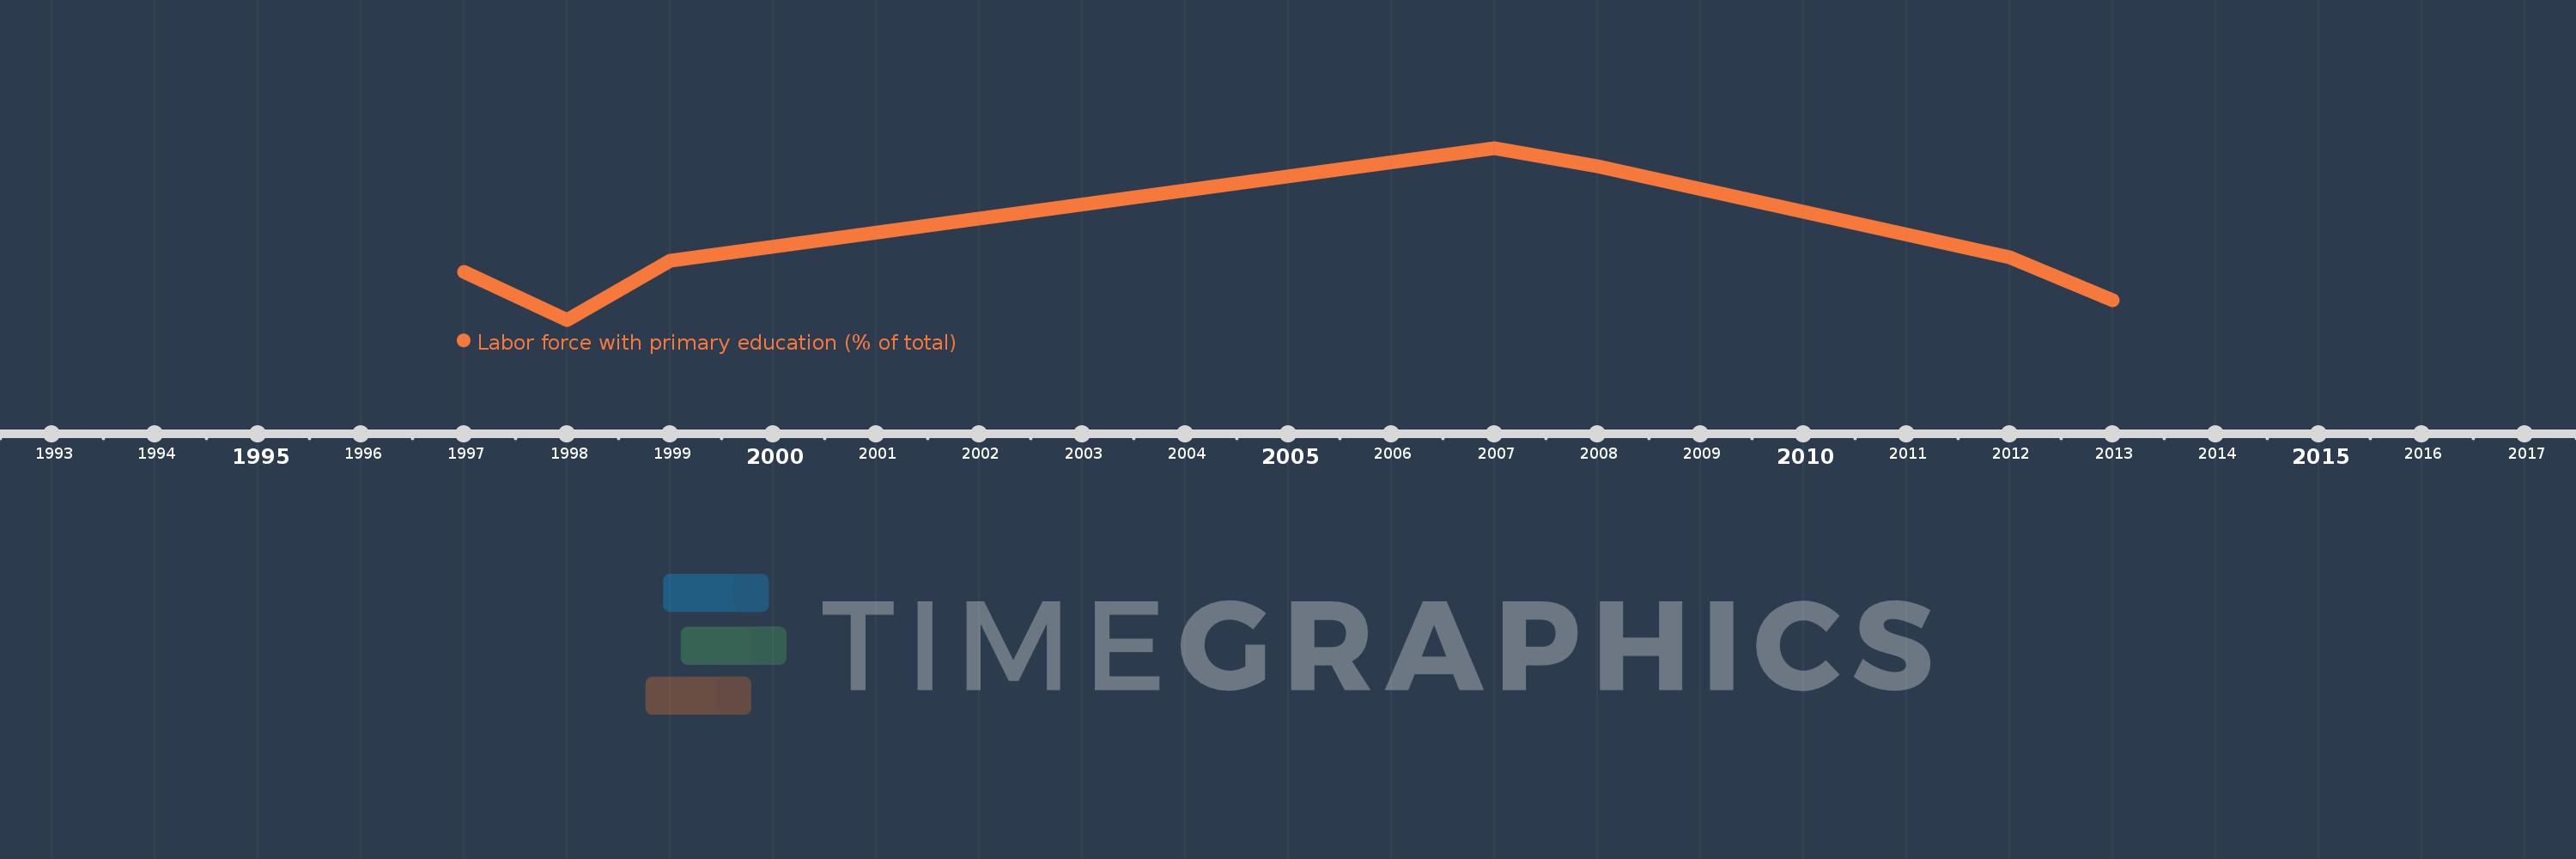
This timeline shows a graph from 1997 to 2013 of Latin America & the Caribbean (IDA & IBRD countries). No data until 1996. Number of actual observations by date: 7.
Source name:
World Development Indicators
Source organization:
International Labour Organization, Key Indicators of the Labour Market database.
Categories, topics:
Education, Social Protection & Labor
Last updated:
apr 23, 2017
Indicators value changes by year
Meaning:
33.89
Minimum:
25.841
jan 1, 1998
Maximum:
44.682
jan 1, 2007
At the date of observation
Value
Absolute change
Change from the previous value
jan 1, 1997
31.077
+31.077
0.0%
jan 1, 1998
25.841
-5.235
-16.85%
jan 1, 1999
32.295
+6.453
24.97%
jan 1, 2007
44.682
+12.387
38.36%
jan 1, 2008
42.672
-2.01
-4.5%
jan 1, 2012
32.676
-9.996
-23.43%
jan 1, 2013
27.986
-4.69
-14.35%
Ranking of countries by current statistics by years