30
/
AIzaSyAYiBZKx7MnpbEhh9jyipgxe19OcubqV5w
April 1, 2024
32754
Europe & Central Asia (IDA & IBRD countries)
TEC
false
2
1
Labor force with primary education (% of total)
2014,2013,2012,2011,2010,2009,2008,2007,2006,2005,2004,2003
Download
Global statistics library →Europe & Central Asia (IDA & IBRD countries) →

Labor force with primary education (% of total)

This statistics in other country:

AlbaniaAlgeriaAntigua and BarbudaArgentinaArmeniaArubaAustraliaAustriaAzerbaijanBahamas, TheBahrainBarbadosBelarusBelgiumBelizeBermudaBoliviaBosnia and HerzegovinaBotswanaBrazilBritish Virgin IslandsBulgariaCambodiaCanadaCayman IslandsCentral Europe and the BalticsChadChileColombiaCosta RicaCroatiaCubaCyprusCzech RepublicDenmarkDominicaDominican RepublicEarly-demographic dividendEcuadorEgypt, Arab Rep.El SalvadorEstoniaEthiopiaEuro areaEurope & Central AsiaEurope & Central Asia (excluding high income)Europe & Central Asia (IDA & IBRD countries)European UnionFinlandFranceFrench PolynesiaGeorgiaGermanyGhanaGreeceGuatemalaGuyanaHigh incomeHondurasHong Kong SAR, ChinaHungaryIcelandIndiaIndonesiaIran, Islamic Rep.IrelandIsraelItalyJapanJordanKazakhstanKorea, Rep.KosovoKuwaitKyrgyz RepublicLatin America & Caribbean Latin America & Caribbean (excluding high income)Latin America & the Caribbean (IDA & IBRD countries)LatviaLebanonLithuaniaLuxembourgMacao SAR, ChinaMacedonia, FYRMadagascarMalaysiaMaltaMauritiusMexicoMoldovaMongoliaMontenegroMoroccoNamibiaNepalNetherlandsNew CaledoniaNew ZealandNicaraguaNigerNigeriaNorth AmericaNorwayOECD membersOmanPakistanPanamaParaguayPeruPhilippinesPolandPortugalPost-demographic dividendRomaniaRussian FederationRwandaSan MarinoSaudi ArabiaSerbiaSingaporeSlovak RepublicSloveniaSouth AfricaSouth AsiaSouth Asia (IDA & IBRD)SpainSri LankaSt. Kitts and NevisSt. LuciaSt. Vincent and the GrenadinesSwedenSwitzerlandSyrian Arab RepublicTajikistanThailandTimor-LesteTrinidad and TobagoTunisiaTurkeyUgandaUkraineUnited Arab EmiratesUnited KingdomUnited StatesUruguayVenezuela, RBWest Bank and GazaYemen, Rep.

Timeline:

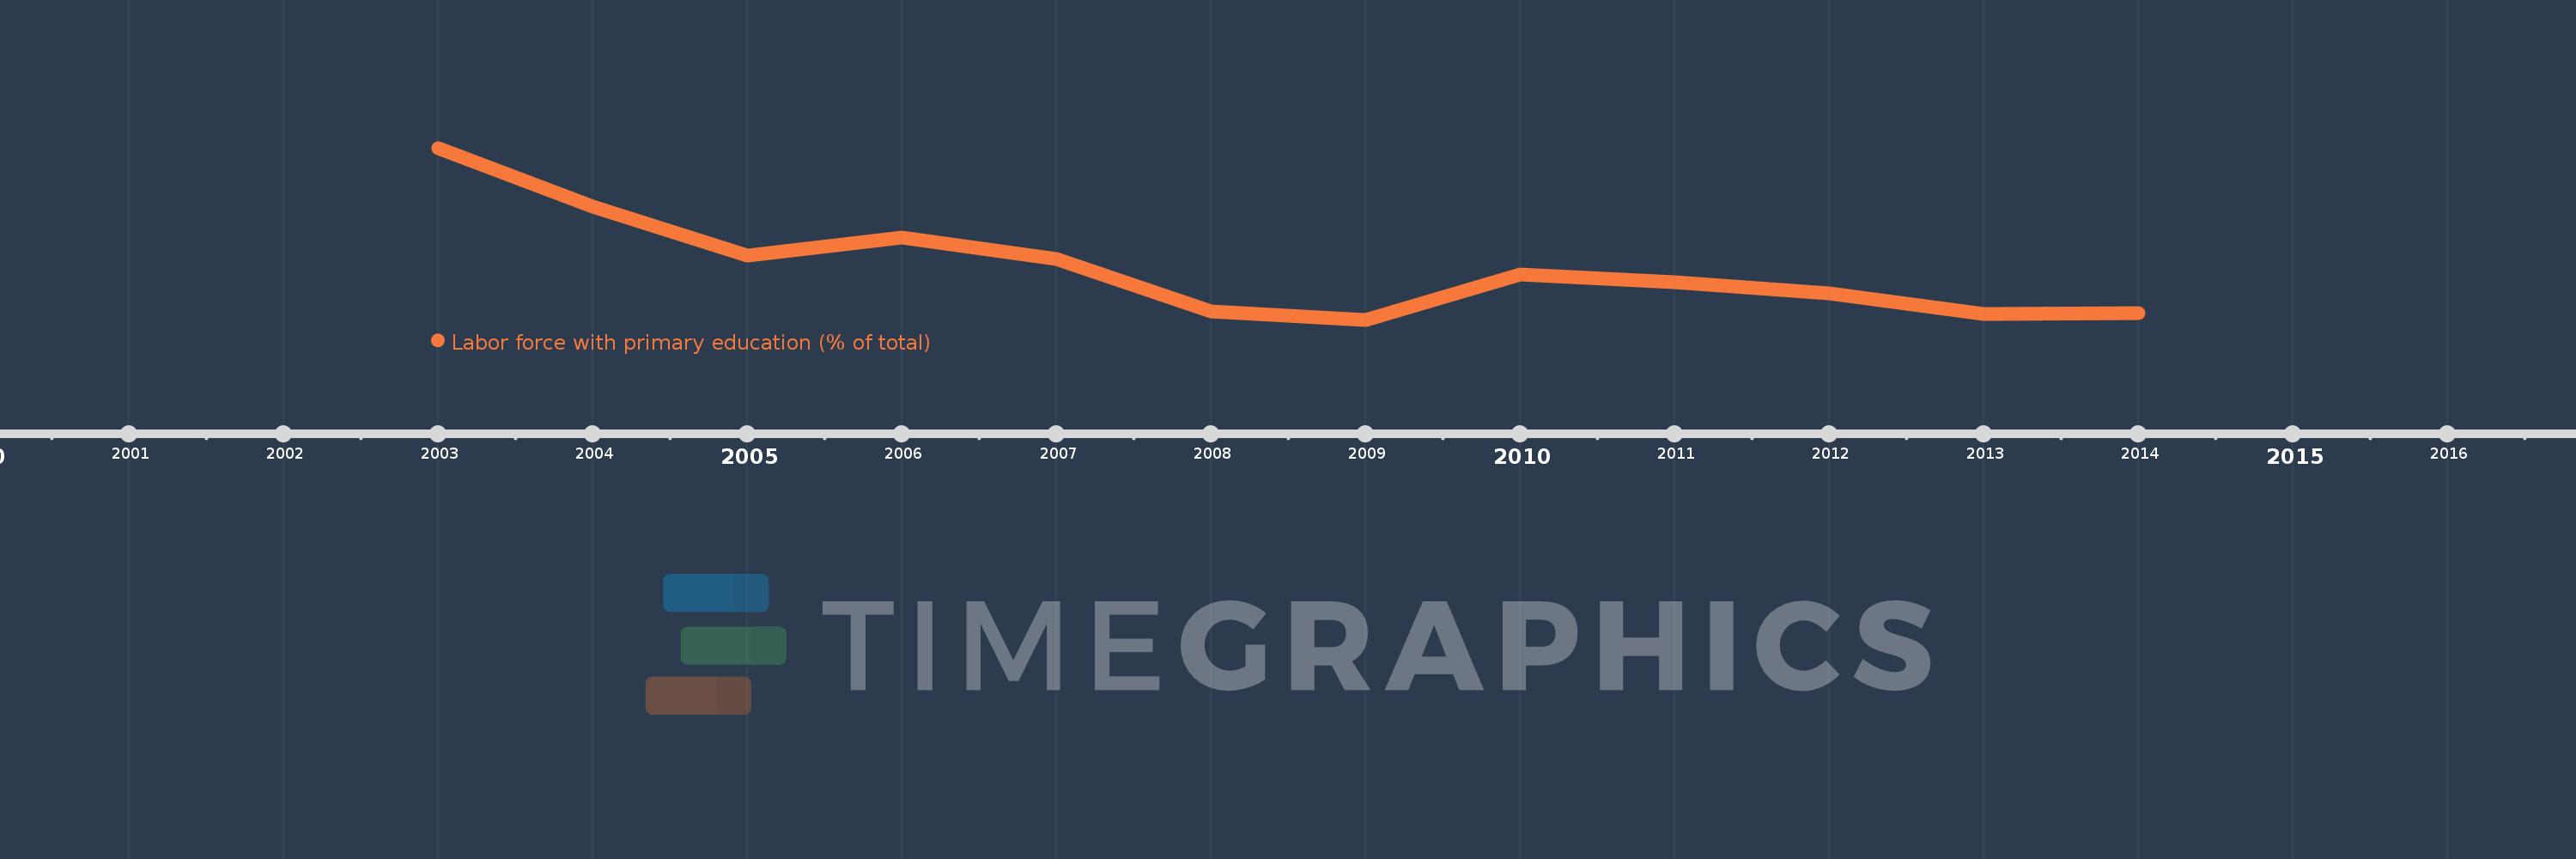
This timeline shows a graph from 2003 to 2014 of Europe & Central Asia (IDA & IBRD countries). No data until 2002. Number of actual observations by date: 12.

Source name:

World Development Indicators

Source organization:

International Labour Organization, Key Indicators of the Labour Market database.

Categories, topics:

Education, Social Protection & Labor

Last updated:

apr 23, 2017

Indicators value changes by year

Meaning:
17.886
Minimum:
16.431
jan 1, 2009
Maximum:
21.26
jan 1, 2003
At the date of observation
Value
Absolute change
Change from the previous value
jan 1, 2003
21.26
+21.26
0.0%
jan 1, 2004
19.601
-1.658
-7.8%
jan 1, 2005
18.233
-1.368
-6.98%
jan 1, 2006
18.741
+0.508
2.78%
jan 1, 2007
18.134
-0.607
-3.24%
jan 1, 2008
16.667
-1.467
-8.09%
jan 1, 2009
16.431
-0.236
-1.42%
jan 1, 2010
17.713
+1.282
7.8%
jan 1, 2011
17.484
-0.229
-1.29%
jan 1, 2012
17.172
-0.311
-1.78%
jan 1, 2013
16.587
-0.585
-3.41%
jan 1, 2014
16.608
+0.021
0.13%

Ranking of countries by current statistics by years