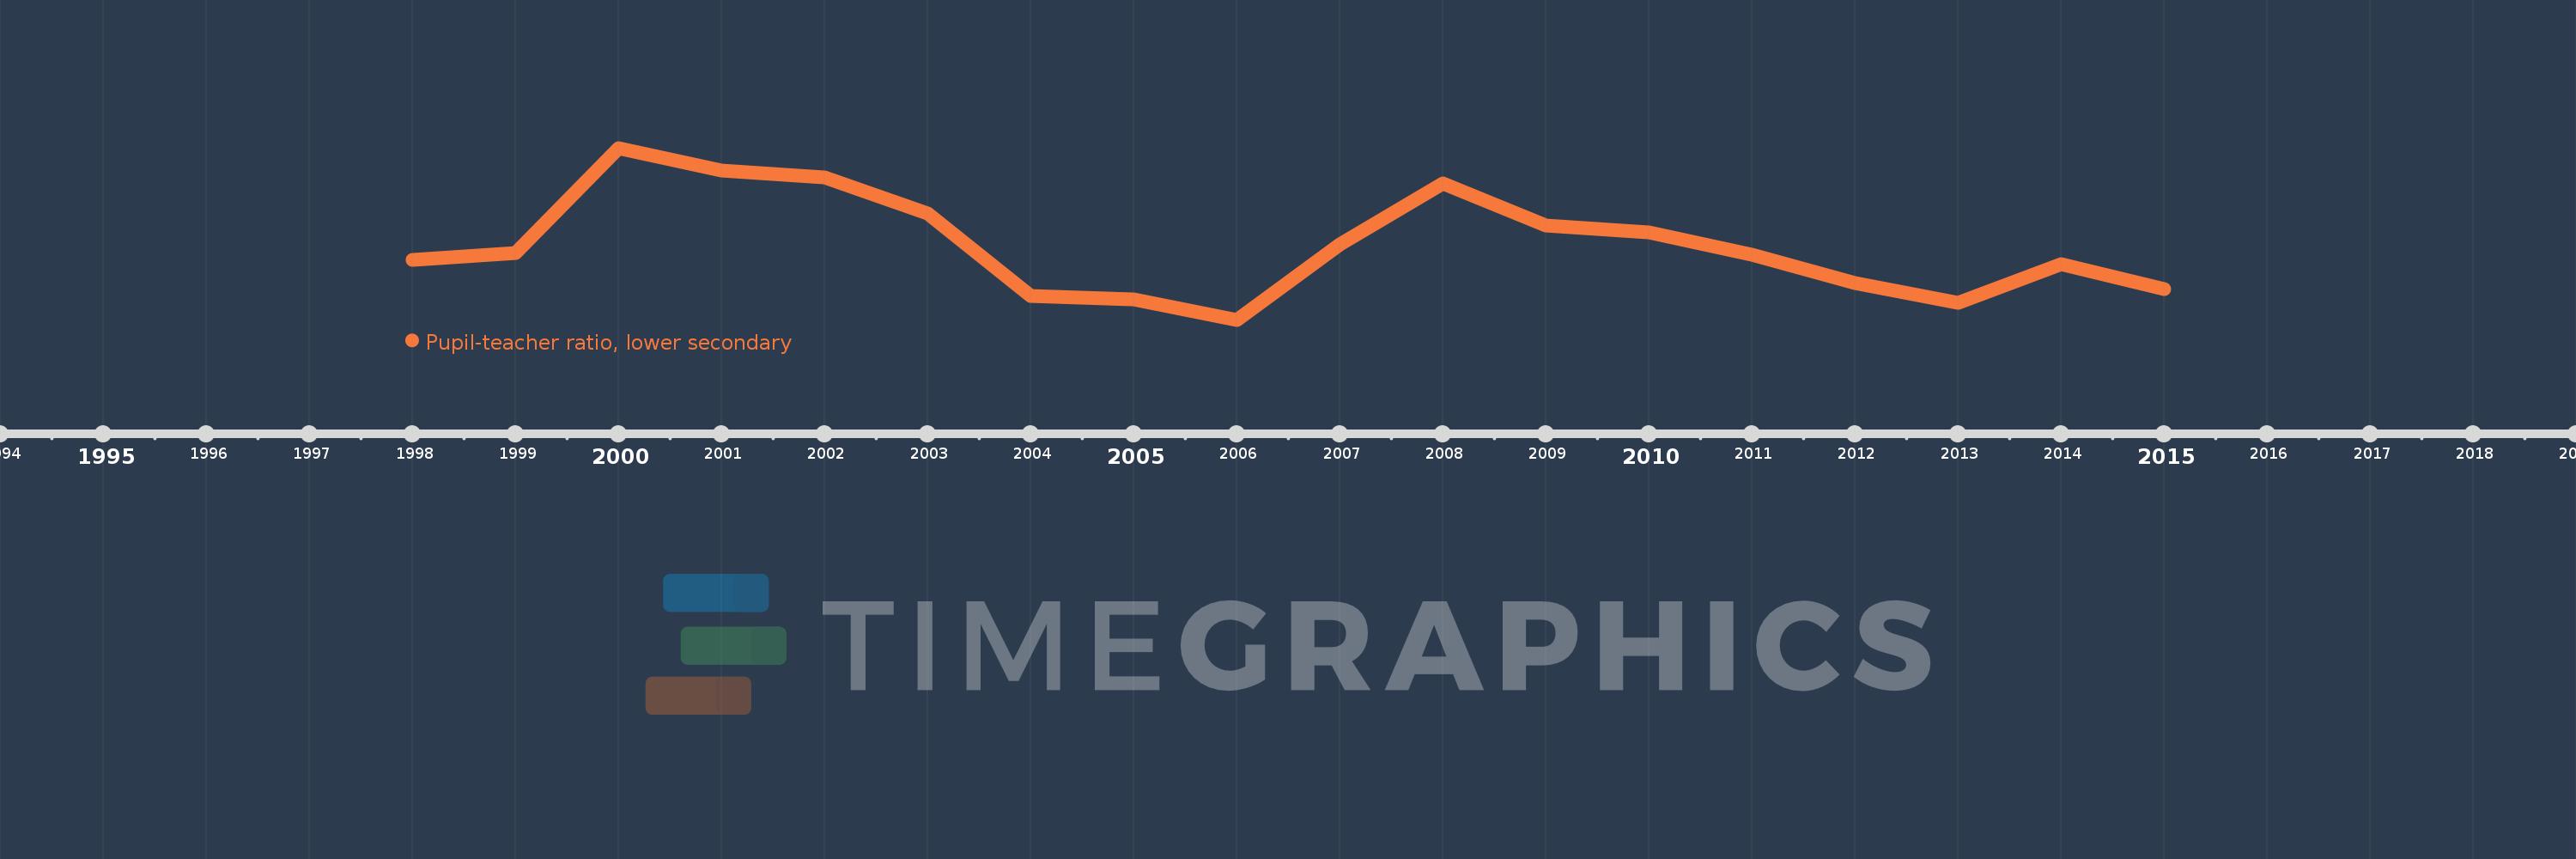
This timeline shows a graph from 1998 to 2015 of Latin America & Caribbean (excluding high income). No data until 1997. Number of actual observations by date: 18.
Source name:
World Development Indicators
Source organization:
United Nations Educational, Scientific, and Cultural Organization (UNESCO) Institute for Statistics.
Categories, topics:
Education
Last updated:
apr 23, 2017
Indicators value changes by year
Meaning:
18.7
Minimum:
17.724
jan 1, 2006
Maximum:
19.978
jan 1, 2000
At the date of observation
Value
Absolute change
Change from the previous value
jan 1, 1998
18.508
+18.508
0.0%
jan 1, 1999
18.604
+0.095
0.52%
jan 1, 2000
19.978
+1.374
7.39%
jan 1, 2001
19.685
-0.292
-1.46%
jan 1, 2002
19.59
-0.095
-0.48%
jan 1, 2003
19.121
-0.469
-2.39%
jan 1, 2004
18.033
-1.088
-5.69%
jan 1, 2005
17.987
-0.045
-0.25%
jan 1, 2006
17.724
-0.263
-1.46%
jan 1, 2007
18.717
+0.993
5.6%
jan 1, 2008
19.517
+0.8
4.28%
jan 1, 2009
18.958
-0.56
-2.87%
jan 1, 2010
18.865
-0.093
-0.49%
jan 1, 2011
18.58
-0.285
-1.51%
jan 1, 2012
18.21
-0.369
-1.99%
jan 1, 2013
17.941
-0.269
-1.48%
jan 1, 2014
18.452
+0.51
2.84%
jan 1, 2015
18.131
-0.321
-1.74%
Ranking of countries by current statistics by years