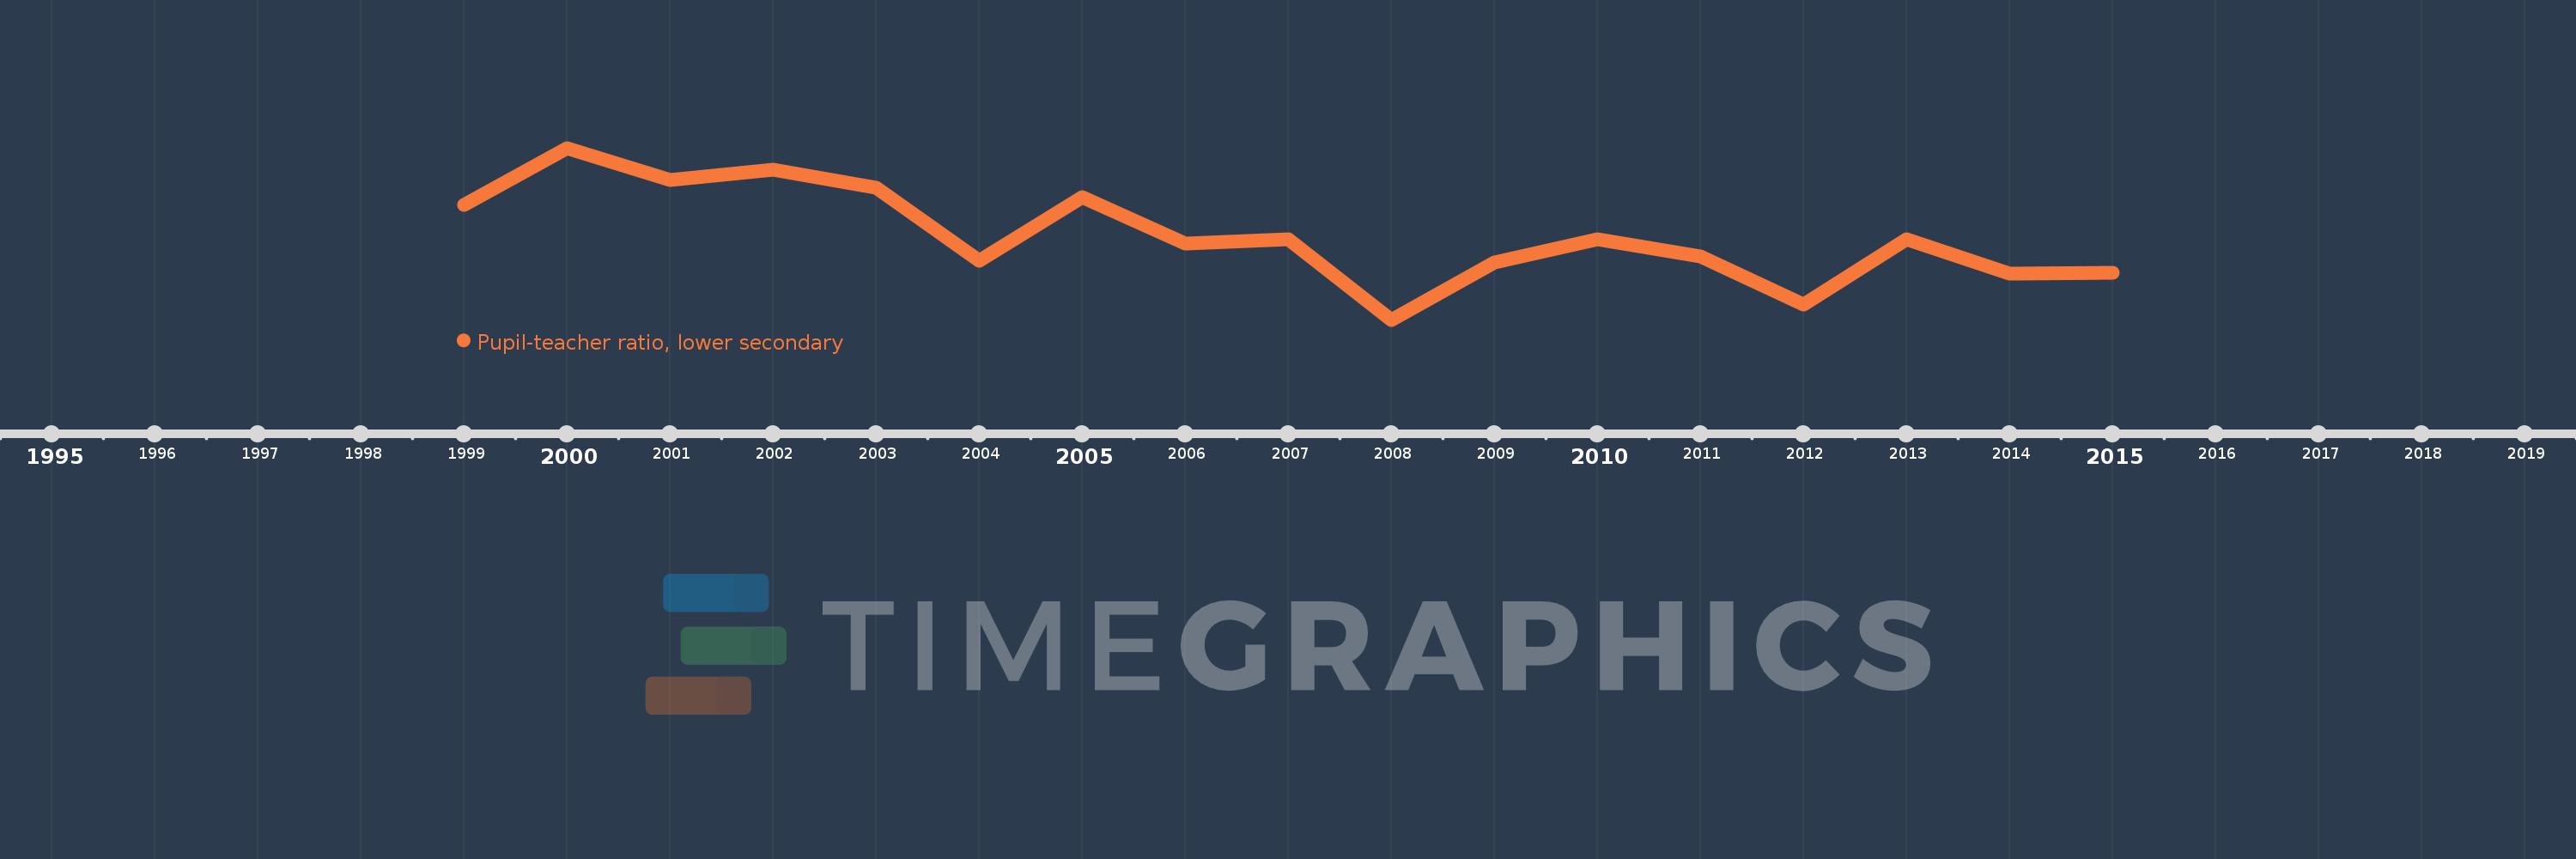
This timeline shows a graph from 1999 to 2015 of Fragile and conflict affected situations. No data until 1998. Number of actual observations by date: 17.
Source name:
World Development Indicators
Source organization:
United Nations Educational, Scientific, and Cultural Organization (UNESCO) Institute for Statistics.
Categories, topics:
Education
Last updated:
apr 23, 2017
Indicators value changes by year
Meaning:
23.525
Minimum:
22.787
jan 1, 2008
Maximum:
24.286
jan 1, 2000
At the date of observation
Value
Absolute change
Change from the previous value
jan 1, 1999
23.791
+23.791
0.0%
jan 1, 2000
24.286
+0.494
2.08%
jan 1, 2001
24.007
-0.278
-1.15%
jan 1, 2002
24.095
+0.088
0.37%
jan 1, 2003
23.939
-0.156
-0.65%
jan 1, 2004
23.3
-0.639
-2.67%
jan 1, 2005
23.854
+0.554
2.38%
jan 1, 2006
23.455
-0.399
-1.67%
jan 1, 2007
23.487
+0.032
0.14%
jan 1, 2008
22.787
-0.7
-2.98%
jan 1, 2009
23.286
+0.498
2.19%
jan 1, 2010
23.487
+0.202
0.87%
jan 1, 2011
23.341
-0.147
-0.62%
jan 1, 2012
22.923
-0.417
-1.79%
jan 1, 2013
23.492
+0.568
2.48%
jan 1, 2014
23.191
-0.301
-1.28%
jan 1, 2015
23.197
+0.006
0.03%
Ranking of countries by current statistics by years