33
/
AIzaSyAYiBZKx7MnpbEhh9jyipgxe19OcubqV5w
August 1, 2025
38596
IDA blend
IDB
false
2
1
Social contributions (% of revenue)
2003,2002,1998,1997
Download
Global statistics library →IDA blend →

Social contributions (% of revenue)

This statistics in other country:

AfghanistanAlbaniaAngolaArgentinaArmeniaAustraliaAustriaAzerbaijanBarbadosBelarusBelgiumBelizeBeninBhutanBoliviaBosnia and HerzegovinaBrazilBulgariaBurundiCabo VerdeCanadaCaribbean small statesCentral African RepublicCentral Europe and the BalticsChileChinaColombiaCongo, Rep.Costa RicaCote d'IvoireCroatiaCyprusCzech RepublicDenmarkDominican RepublicEgypt, Arab Rep.El SalvadorEstoniaEthiopiaEuro areaEurope & Central AsiaEurope & Central Asia (excluding high income)Europe & Central Asia (IDA & IBRD countries)European UnionFijiFinlandFranceGambia, TheGeorgiaGermanyGhanaGreeceGuatemalaHigh incomeHondurasHong Kong SAR, ChinaHungaryIBRD onlyIcelandIDA blendIndiaIndonesiaIran, Islamic Rep.IraqIrelandIsraelItalyJamaicaJapanJordanKazakhstanKenyaKorea, Rep.Late-demographic dividendLatin America & Caribbean Latin America & Caribbean (excluding high income)Latin America & the Caribbean (IDA & IBRD countries)LatviaLebanonLiberiaLithuaniaLuxembourgMacao SAR, ChinaMacedonia, FYRMadagascarMaltaMauritiusMexicoMoldovaMongoliaMoroccoMozambiqueNamibiaNetherlandsNew ZealandNorth AmericaNorwayOECD membersPanamaPapua New GuineaParaguayPeruPolandPortugalPost-demographic dividendRomaniaRussian FederationSan MarinoSao Tome and PrincipeSerbiaSeychellesSlovak RepublicSloveniaSmall statesSouth AfricaSouth AsiaSouth Asia (IDA & IBRD)SpainSri LankaSt. Kitts and NevisSwedenSwitzerlandSyrian Arab RepublicTajikistanThailandTrinidad and TobagoTunisiaTurkeyUkraineUnited Arab EmiratesUnited KingdomUnited StatesUpper middle incomeUruguayVenezuela, RBZambiaZimbabwe

Timeline:

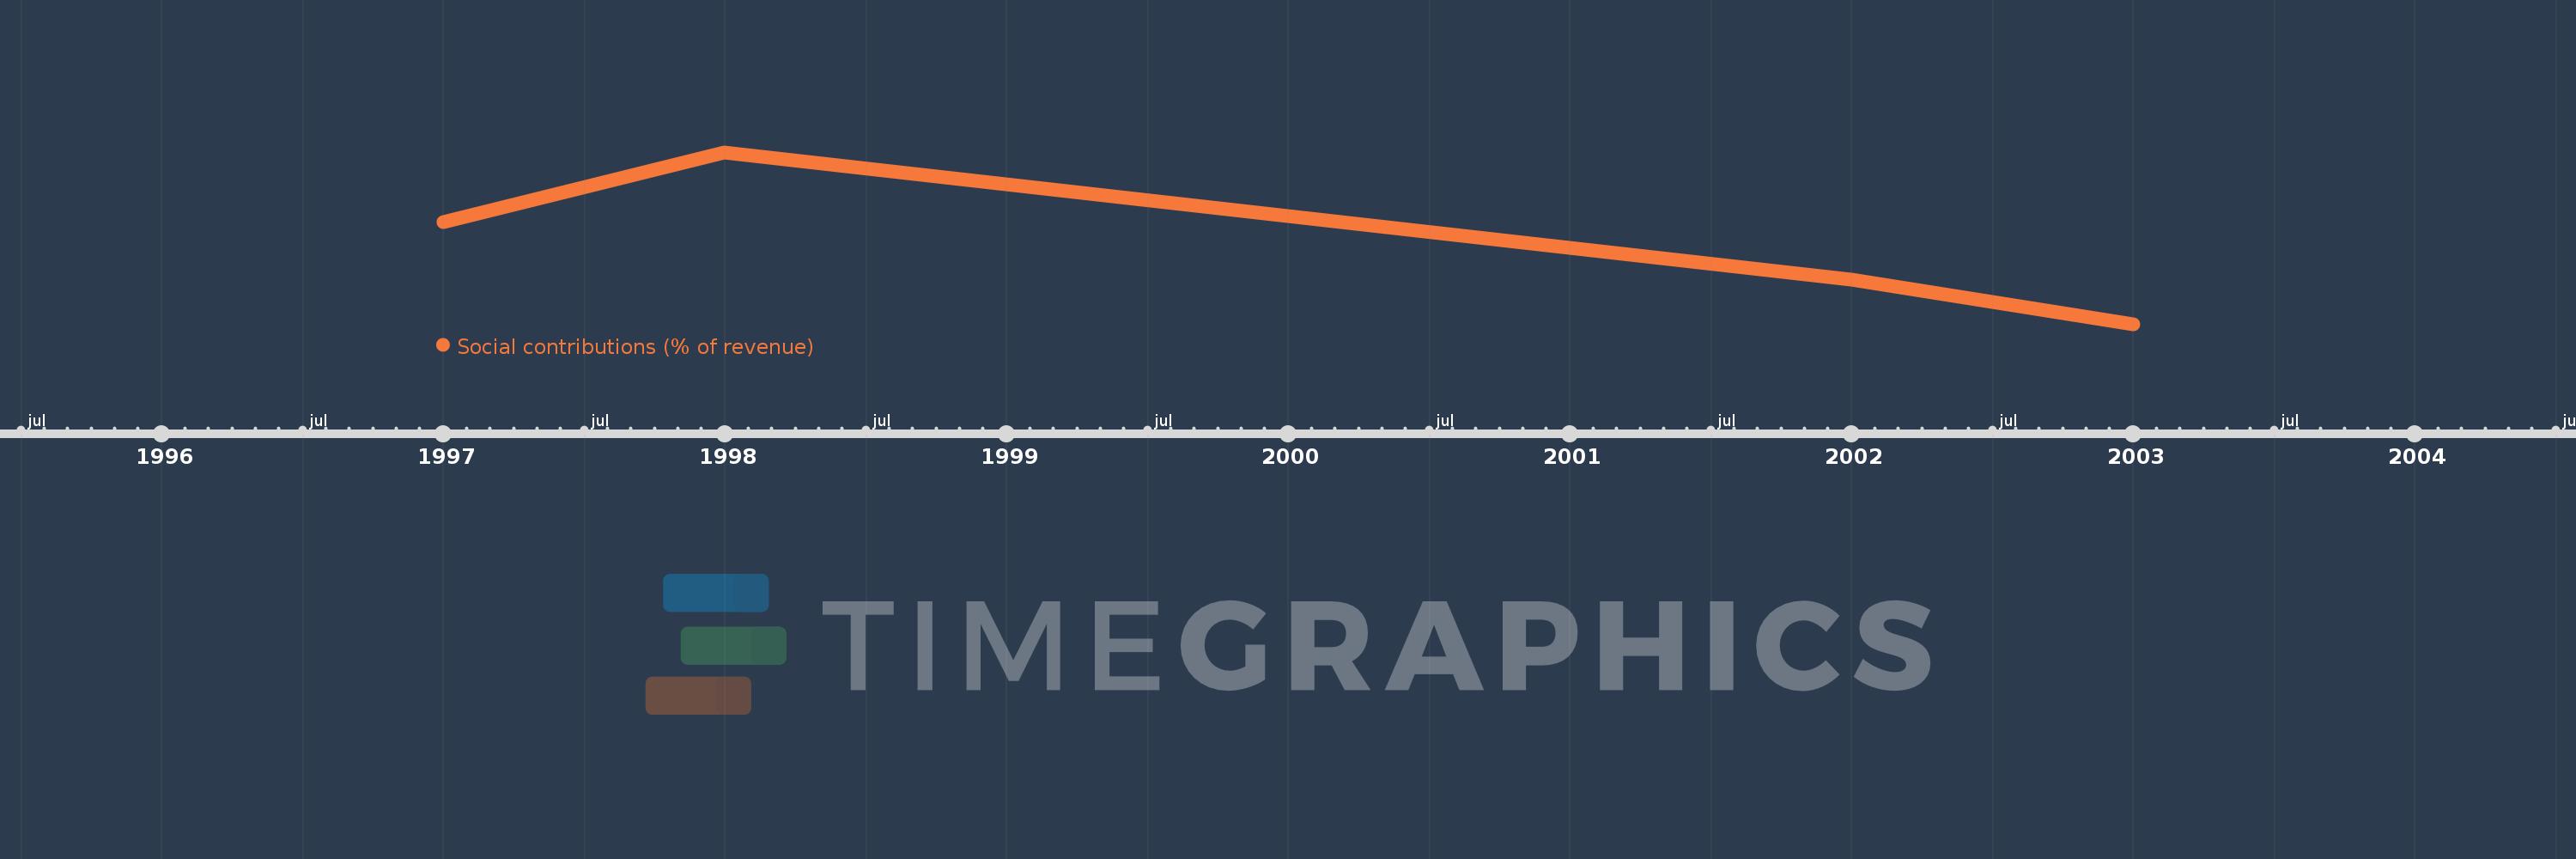
This timeline shows a graph from 1997 to 2003 of IDA blend. No data until 1996. Number of actual observations by date: 4.

Source name:

World Development Indicators

Source organization:

International Monetary Fund, Government Finance Statistics Yearbook and data files.

Categories, topics:

Public Sector

Last updated:

apr 23, 2017

Indicators value changes by year

Meaning:
6.854
Minimum:
6.051
jan 1, 2003
Maximum:
7.781
jan 1, 1998
At the date of observation
Value
Absolute change
Change from the previous value
jan 1, 1997
7.083
+7.083
0.0%
jan 1, 1998
7.781
+0.698
9.85%
jan 1, 2002
6.499
-1.282
-16.48%
jan 1, 2003
6.051
-0.448
-6.89%

Ranking of countries by current statistics by years