33
/
AIzaSyB4mHJ5NPEv-XzF7P6NDYXjlkCWaeKw5bc
November 30, 2025
242127
Slovak Republic
SVK
true
2
1
Social contributions (% of revenue)
2015,2014,2013,2012,2011,2010,2009,2008,2007
Create a timeline
Public Timelines
For education
For educational institutions
For teachers
For students
Cabinet
For educational institutions
For teachers
For students
Open cabinet
FAQ
Close
Create a timeline
Public timelines
FAQ
About & Feedback
Terms
Privacy
FAQ
Support 24/7
Cabinet
Get premium
Donate
Download
Global statistics library
→
Slovak Republic
→
Social contributions (% of revenue)
This statistics in other country:
Afghanistan
Albania
Angola
Argentina
Armenia
Australia
Austria
Azerbaijan
Barbados
Belarus
Belgium
Belize
Benin
Bhutan
Bolivia
Bosnia and Herzegovina
Brazil
Bulgaria
Burundi
Cabo Verde
Canada
Caribbean small states
Central African Republic
Central Europe and the Baltics
Chile
China
Colombia
Congo, Rep.
Costa Rica
Cote d'Ivoire
Croatia
Cyprus
Czech Republic
Denmark
Dominican Republic
Egypt, Arab Rep.
El Salvador
Estonia
Ethiopia
Euro area
Europe & Central Asia
Europe & Central Asia (excluding high income)
Europe & Central Asia (IDA & IBRD countries)
European Union
Fiji
Finland
France
Gambia, The
Georgia
Germany
Ghana
Greece
Guatemala
High income
Honduras
Hong Kong SAR, China
Hungary
IBRD only
Iceland
IDA blend
India
Indonesia
Iran, Islamic Rep.
Iraq
Ireland
Israel
Italy
Jamaica
Japan
Jordan
Kazakhstan
Kenya
Korea, Rep.
Late-demographic dividend
Latin America & Caribbean
Latin America & Caribbean (excluding high income)
Latin America & the Caribbean (IDA & IBRD countries)
Latvia
Lebanon
Liberia
Lithuania
Luxembourg
Macao SAR, China
Macedonia, FYR
Madagascar
Malta
Mauritius
Mexico
Moldova
Mongolia
Morocco
Mozambique
Namibia
Netherlands
New Zealand
North America
Norway
OECD members
Panama
Papua New Guinea
Paraguay
Peru
Poland
Portugal
Post-demographic dividend
Romania
Russian Federation
San Marino
Sao Tome and Principe
Serbia
Seychelles
Slovak Republic
Slovenia
Small states
South Africa
South Asia
South Asia (IDA & IBRD)
Spain
Sri Lanka
St. Kitts and Nevis
Sweden
Switzerland
Syrian Arab Republic
Tajikistan
Thailand
Trinidad and Tobago
Tunisia
Turkey
Ukraine
United Arab Emirates
United Kingdom
United States
Upper middle income
Uruguay
Venezuela, RB
Zambia
Zimbabwe
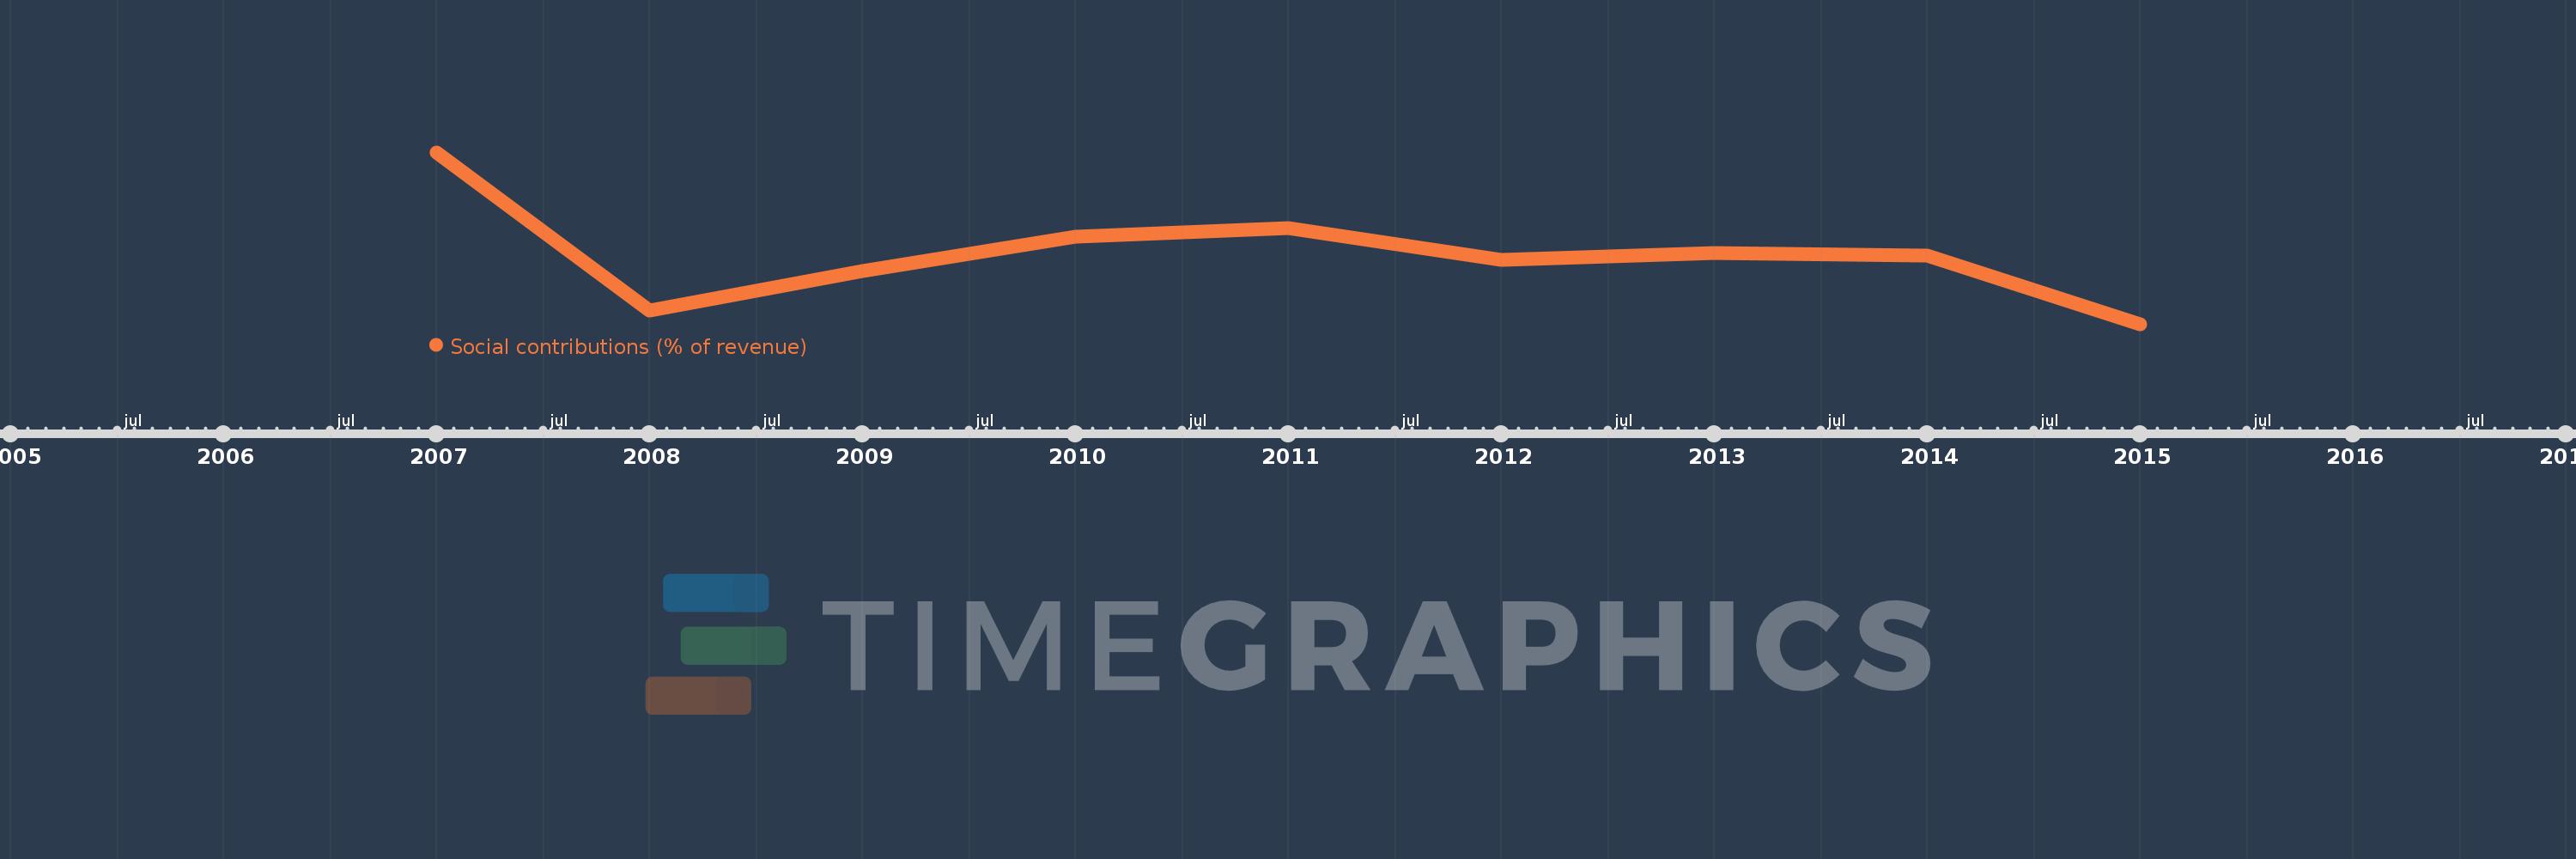
Timeline:
This timeline shows a graph from
2007
to
2015
of Slovak Republic. No data until
2006
. Number of actual observations by date:
9
.
Source name:
World Development Indicators
Source organization:
International Monetary Fund, Government Finance Statistics Yearbook and data files.
Categories, topics:
Public Sector
Last updated:
apr 23, 2017
Indicators value changes by year
Meaning:
1.262
Minimum:
0.74
jan 1, 2015
Maximum:
2.029
jan 1, 2007
At the date of observation
Value
Absolute change
Change from the previous value
jan 1, 2007
2.029
+2.029
0.0%
jan 1, 2008
0.845
-1.185
-58.38%
jan 1, 2009
1.137
+0.293
34.66%
jan 1, 2010
1.394
+0.257
22.56%
jan 1, 2011
1.463
+0.069
4.97%
jan 1, 2012
1.22
-0.243
-16.62%
jan 1, 2013
1.273
+0.053
4.34%
jan 1, 2014
1.255
-0.017
-1.37%
jan 1, 2015
0.74
-0.515
-41.03%
Ranking of countries by current statistics by years
About & Feedback
Terms
Privacy
FAQ
Support 24/7
Cabinet
Get premium
Donate
The service accepts bank transfer (ACH, Wire) or cards (Visa, MasterCard, etc). Processed by Stripe.
Secured with SSL