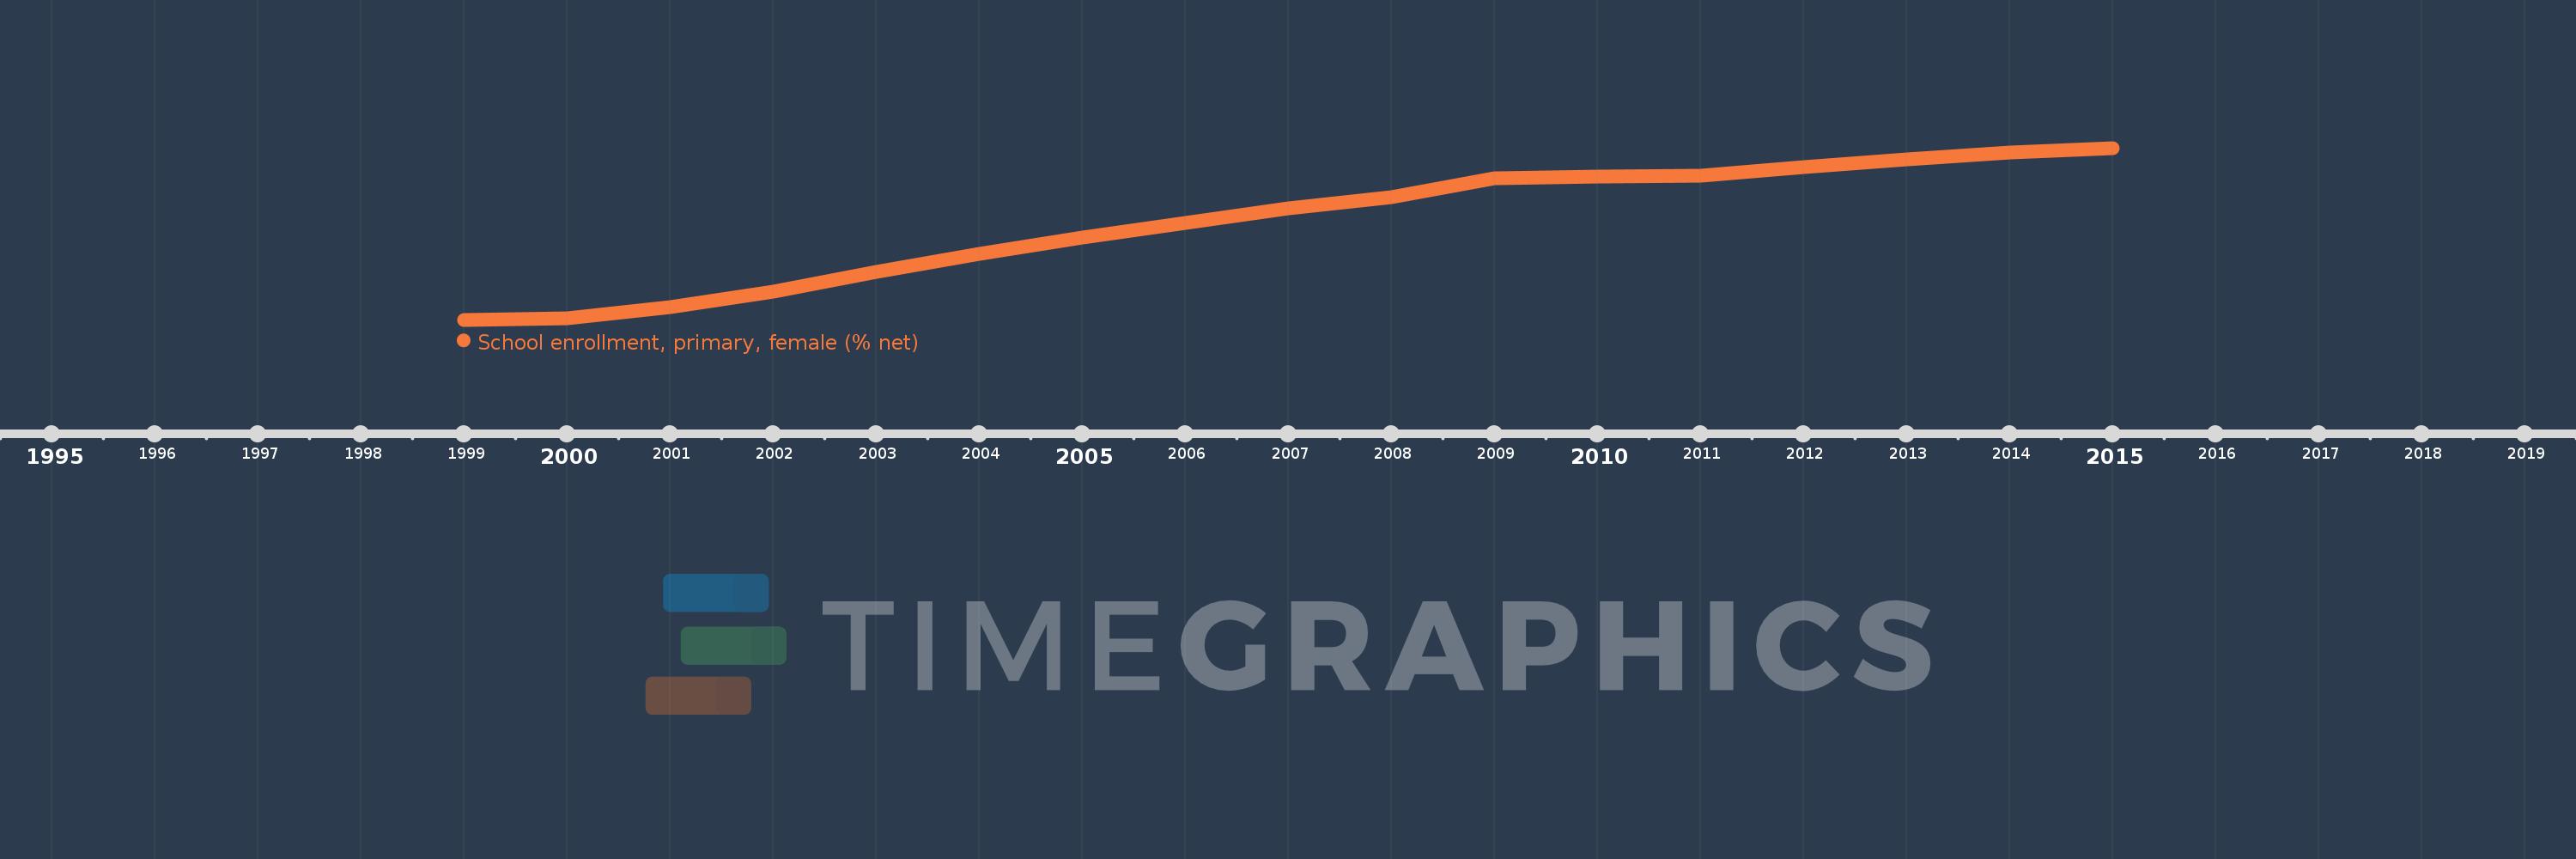
This timeline shows a graph from 1999 to 2015 of Heavily indebted poor countries (HIPC). No data until 1998. Number of actual observations by date: 17.
Source name:
World Development Indicators
Source organization:
United Nations Educational, Scientific, and Cultural Organization (UNESCO) Institute for Statistics.
Categories, topics:
Education, Gender
Last updated:
apr 23, 2017
Indicators value changes by year
Meaning:
64.453
Minimum:
47.169
jan 1, 1999
Maximum:
77.786
jan 1, 2015
At the date of observation
Value
Absolute change
Change from the previous value
jan 1, 1999
47.169
+47.169
0.0%
jan 1, 2000
47.453
+0.284
0.6%
jan 1, 2001
49.409
+1.956
4.12%
jan 1, 2002
52.099
+2.69
5.44%
jan 1, 2003
55.708
+3.609
6.93%
jan 1, 2004
58.864
+3.157
5.67%
jan 1, 2005
61.784
+2.92
4.96%
jan 1, 2006
64.439
+2.655
4.3%
jan 1, 2007
67.056
+2.616
4.06%
jan 1, 2008
69.007
+1.952
2.91%
jan 1, 2009
72.443
+3.436
4.98%
jan 1, 2010
72.691
+0.249
0.34%
jan 1, 2011
72.839
+0.148
0.2%
jan 1, 2012
74.323
+1.484
2.04%
jan 1, 2013
75.678
+1.355
1.82%
jan 1, 2014
76.948
+1.271
1.68%
jan 1, 2015
77.786
+0.838
1.09%
Ranking of countries by current statistics by years