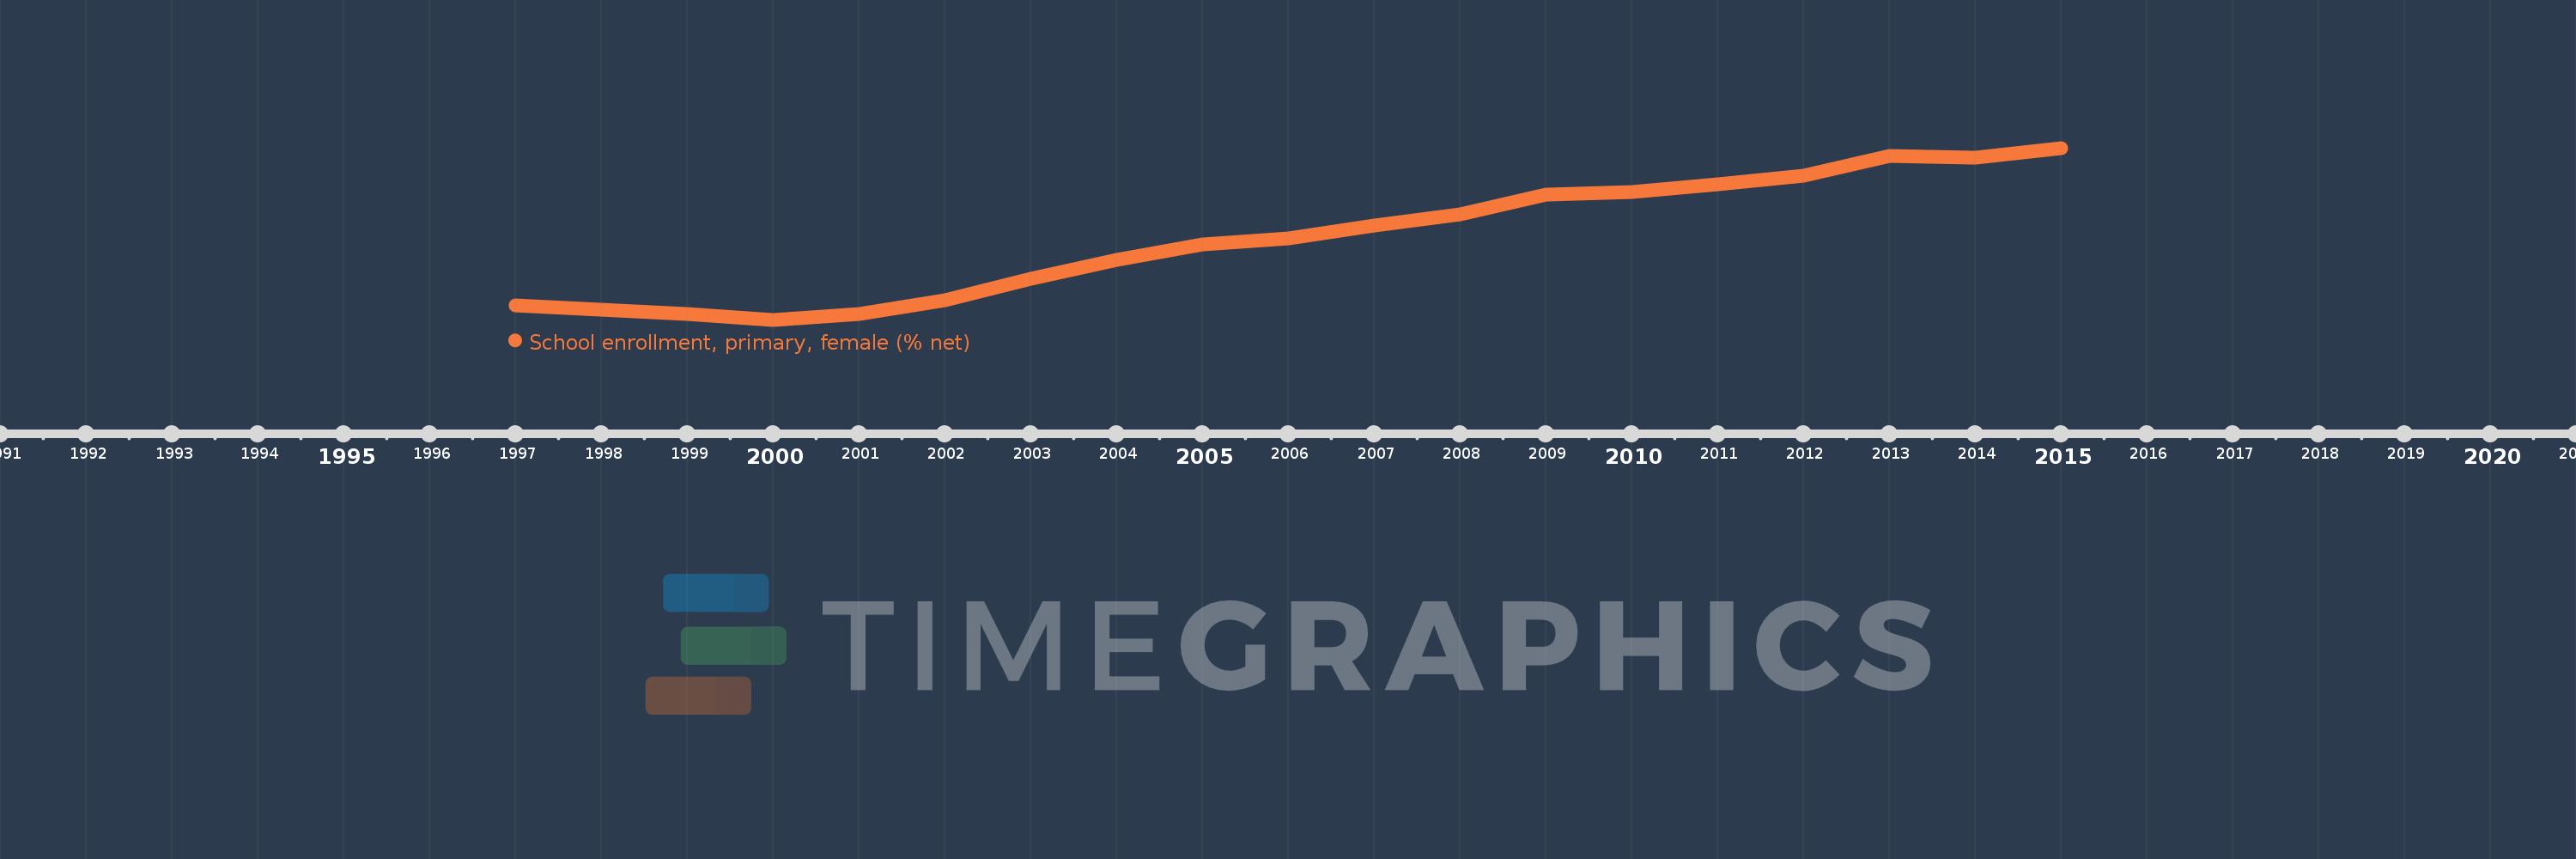
This timeline shows a graph from 1997 to 2015 of Fragile and conflict affected situations. No data until 1996. Number of actual observations by date: 18.
Source name:
World Development Indicators
Source organization:
United Nations Educational, Scientific, and Cultural Organization (UNESCO) Institute for Statistics.
Categories, topics:
Education, Gender
Last updated:
apr 23, 2017
Indicators value changes by year
Meaning:
62.037
Minimum:
51.98
jan 1, 2000
Maximum:
72.275
jan 1, 2015
At the date of observation
Value
Absolute change
Change from the previous value
jan 1, 1997
53.648
+53.648
0.0%
jan 1, 1999
52.679
-0.969
-1.81%
jan 1, 2000
51.98
-0.698
-1.33%
jan 1, 2001
52.622
+0.642
1.23%
jan 1, 2002
54.242
+1.62
3.08%
jan 1, 2003
56.845
+2.603
4.8%
jan 1, 2004
59.04
+2.195
3.86%
jan 1, 2005
60.898
+1.858
3.15%
jan 1, 2006
61.572
+0.675
1.11%
jan 1, 2007
63.085
+1.513
2.46%
jan 1, 2008
64.463
+1.378
2.18%
jan 1, 2009
66.732
+2.269
3.52%
jan 1, 2010
67.101
+0.369
0.55%
jan 1, 2011
67.971
+0.869
1.3%
jan 1, 2012
69.044
+1.073
1.58%
jan 1, 2013
71.334
+2.291
3.32%
jan 1, 2014
71.141
-0.193
-0.27%
jan 1, 2015
72.275
+1.135
1.6%
Ranking of countries by current statistics by years