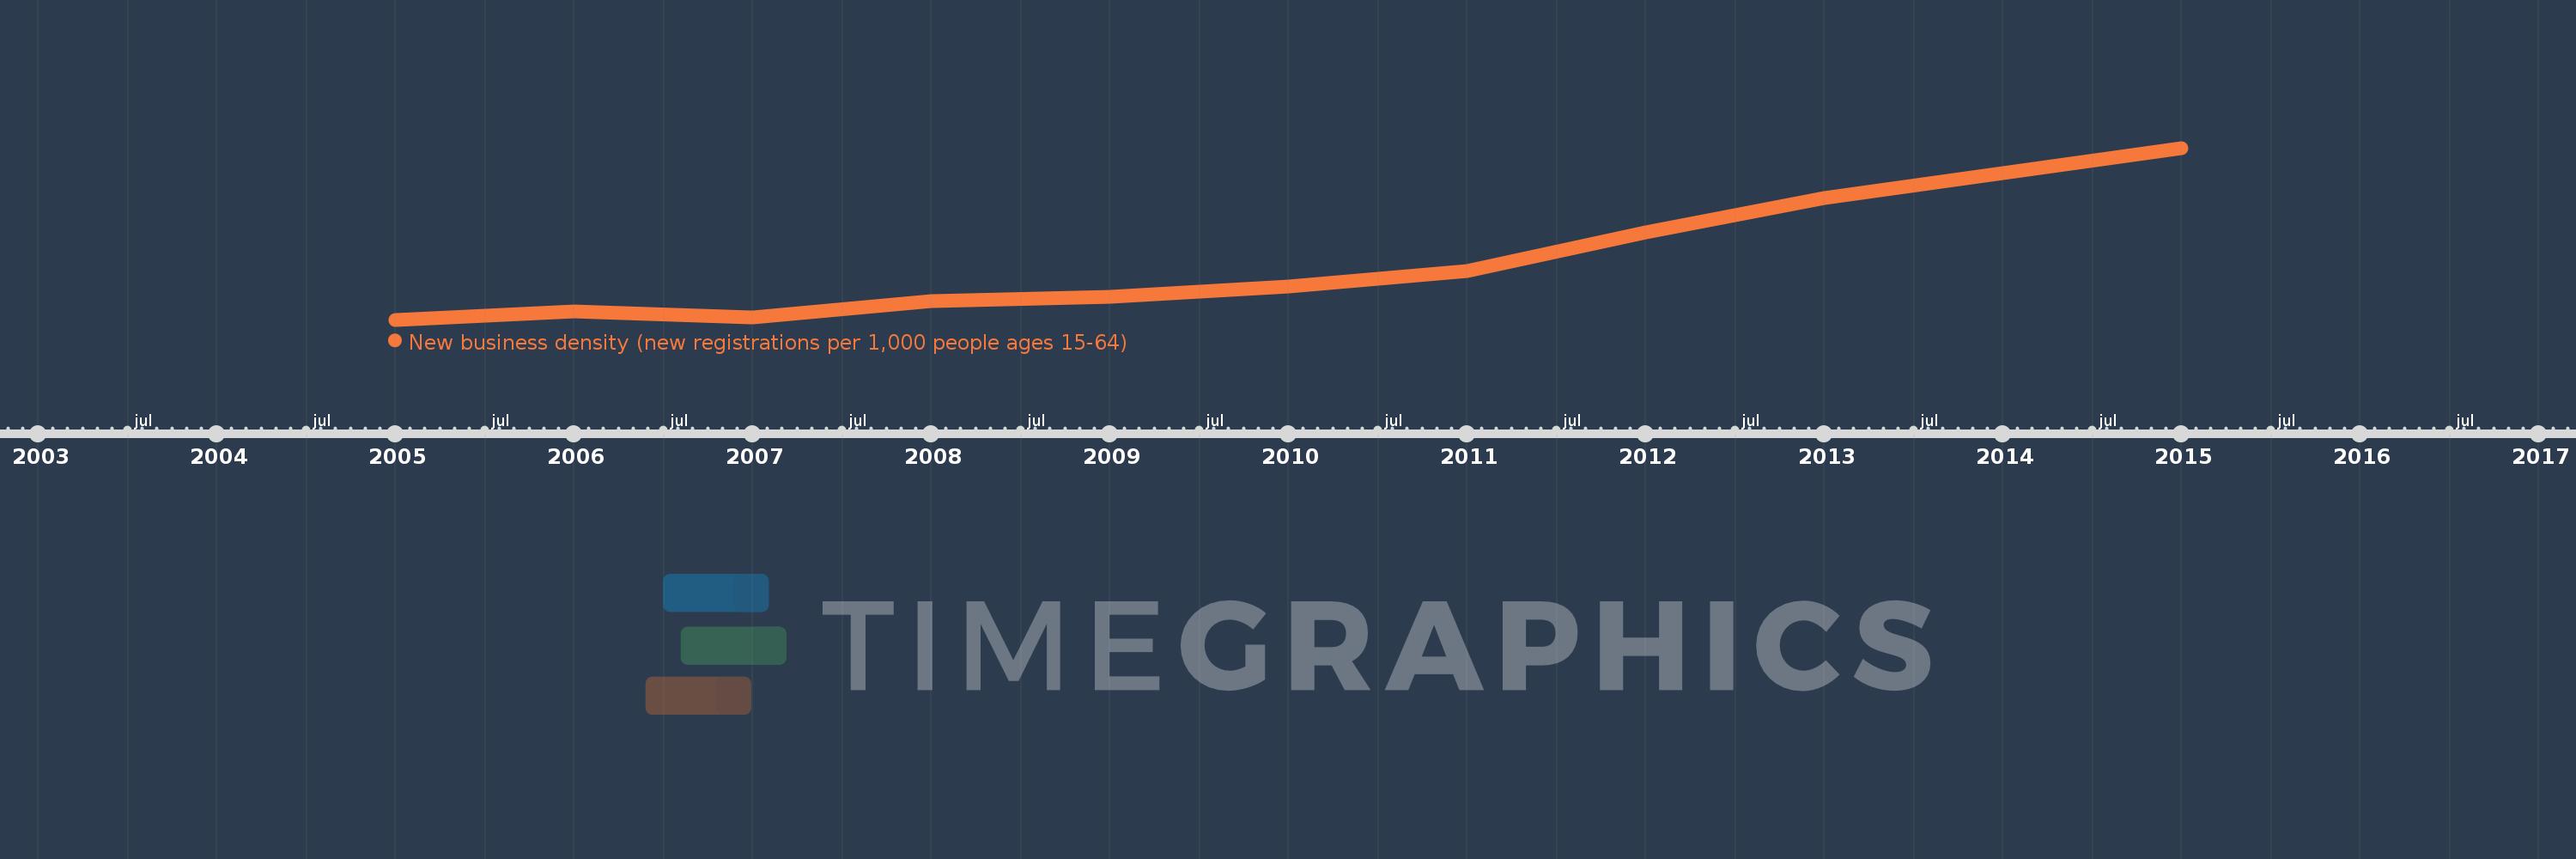
This timeline shows a graph from 2005 to 2015 of Heavily indebted poor countries (HIPC). No data until 2004. Number of actual observations by date: 10.
Source name:
World Development Indicators
Source organization:
World Bank's Entrepreneurship Survey and database (http://econ.worldbank.org/research/entrepreneurship).
Categories, topics:
Private Sector
Last updated:
apr 23, 2017
Indicators value changes by year
Meaning:
0.406
Minimum:
0.205
jan 1, 2005
Maximum:
0.874
jan 1, 2015
At the date of observation
Value
Absolute change
Change from the previous value
jan 1, 2005
0.205
+0.205
0.0%
jan 1, 2006
0.236
+0.031
15.18%
jan 1, 2007
0.215
-0.021
-8.94%
jan 1, 2008
0.277
+0.062
28.85%
jan 1, 2009
0.294
+0.018
6.46%
jan 1, 2010
0.336
+0.042
14.16%
jan 1, 2011
0.396
+0.06
17.78%
jan 1, 2012
0.545
+0.149
37.69%
jan 1, 2013
0.679
+0.134
24.58%
jan 1, 2015
0.874
+0.195
28.78%
Ranking of countries by current statistics by years