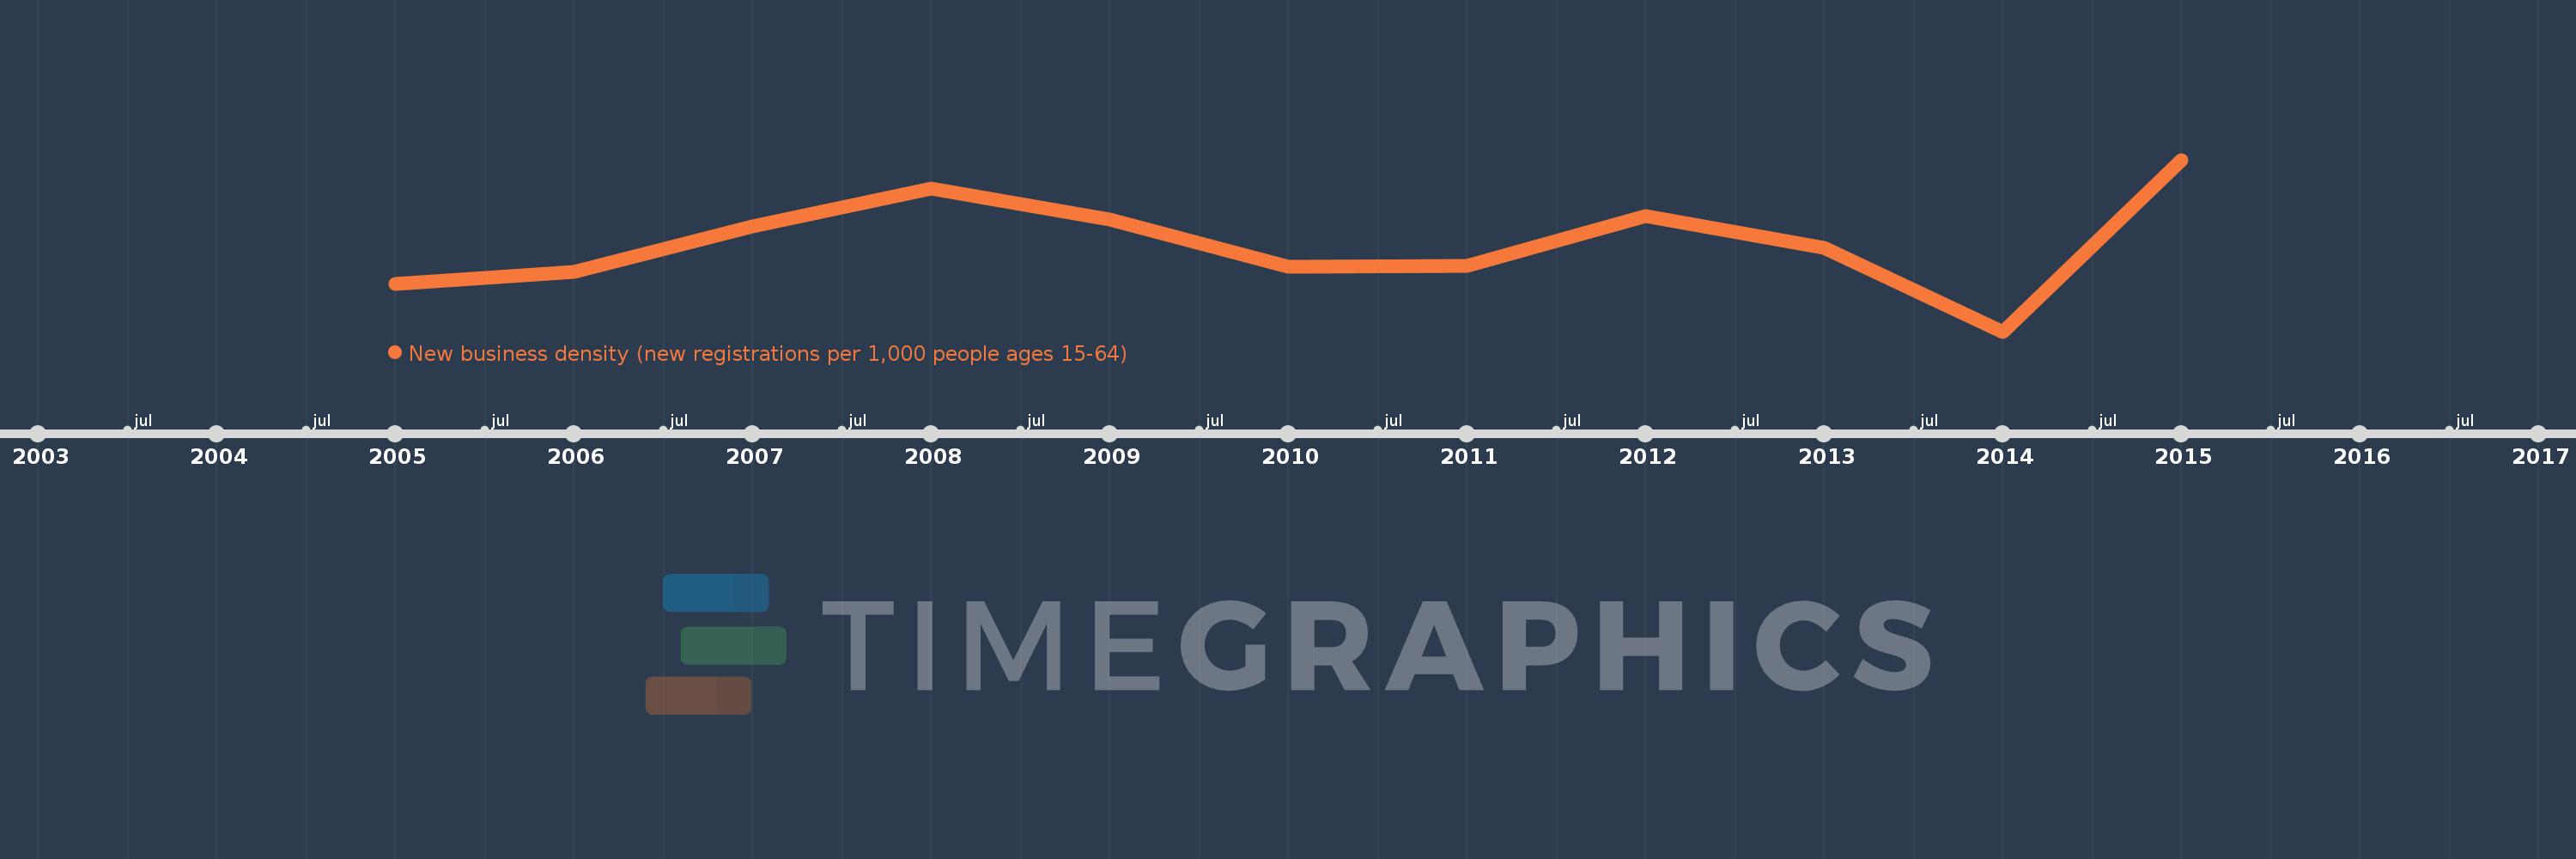
This timeline shows a graph from 2005 to 2015 of Europe & Central Asia (excluding high income). No data until 2004. Number of actual observations by date: 11.
Source name:
World Development Indicators
Source organization:
World Bank's Entrepreneurship Survey and database (http://econ.worldbank.org/research/entrepreneurship).
Categories, topics:
Private Sector
Last updated:
apr 23, 2017
Indicators value changes by year
Meaning:
2.219
Minimum:
1.11
jan 1, 2014
Maximum:
3.273
jan 1, 2015
At the date of observation
Value
Absolute change
Change from the previous value
jan 1, 2005
1.707
+1.707
0.0%
jan 1, 2006
1.861
+0.154
9.03%
jan 1, 2007
2.433
+0.572
30.72%
jan 1, 2008
2.915
+0.482
19.79%
jan 1, 2009
2.524
-0.391
-13.42%
jan 1, 2010
1.924
-0.6
-23.78%
jan 1, 2011
1.937
+0.013
0.68%
jan 1, 2012
2.562
+0.625
32.29%
jan 1, 2013
2.168
-0.394
-15.39%
jan 1, 2014
1.11
-1.058
-48.79%
jan 1, 2015
3.273
+2.163
194.85%
Ranking of countries by current statistics by years