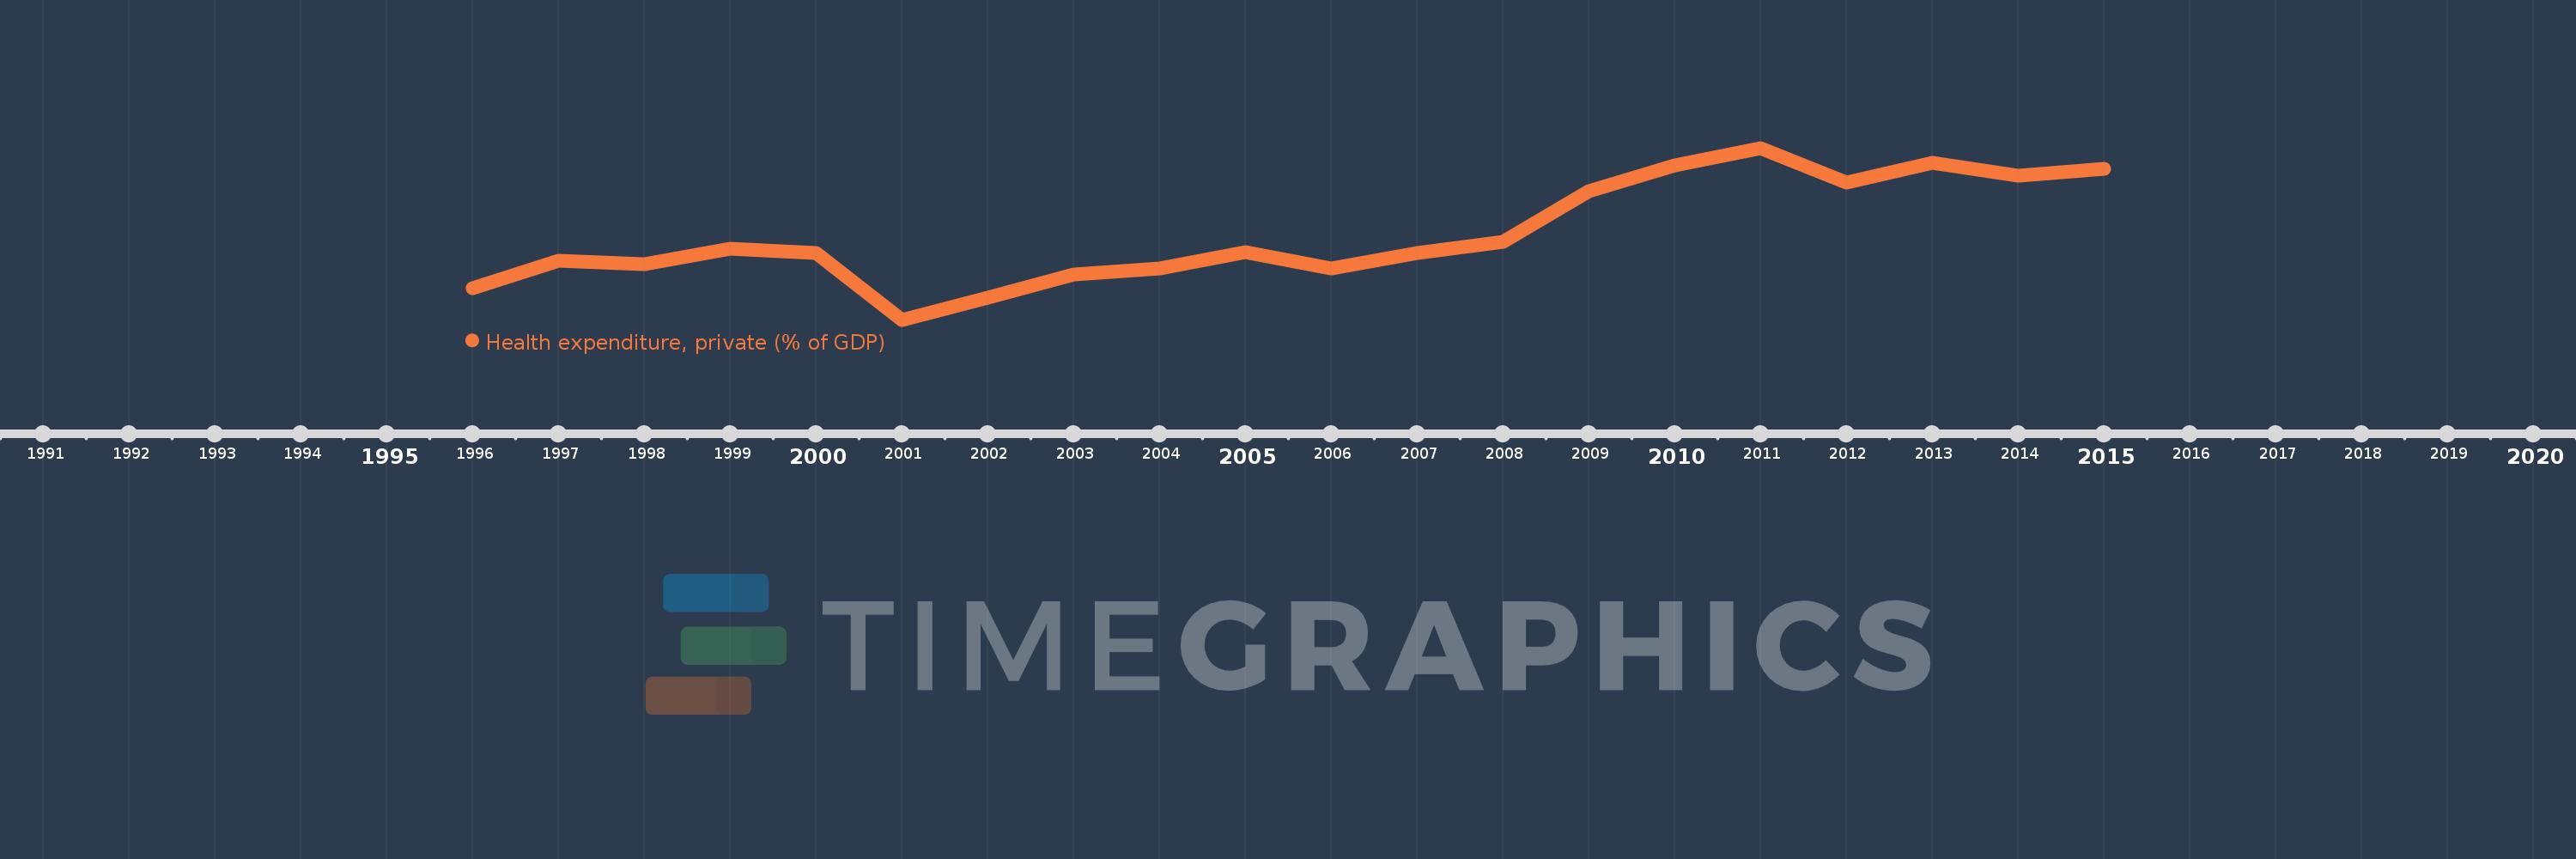
This timeline shows a graph from 1996 to 2015 of Heavily indebted poor countries (HIPC). No data until 1995. Number of actual observations by date: 20.
Source name:
World Development Indicators
Source organization:
World Health Organization Global Health Expenditure database (see http://apps.who.int/nha/database for the most recent updates).
Categories, topics:
Health
Last updated:
apr 23, 2017
Indicators value changes by year
Meaning:
3.154
Minimum:
2.675
jan 1, 2001
Maximum:
3.637
jan 1, 2011
At the date of observation
Value
Absolute change
Change from the previous value
jan 1, 1996
2.852
+2.852
0.0%
jan 1, 1997
3.007
+0.154
5.41%
jan 1, 1998
2.985
-0.022
-0.73%
jan 1, 1999
3.075
+0.091
3.04%
jan 1, 2000
3.049
-0.026
-0.85%
jan 1, 2001
2.675
-0.374
-12.27%
jan 1, 2002
2.798
+0.123
4.6%
jan 1, 2003
2.927
+0.128
4.59%
jan 1, 2004
2.964
+0.038
1.3%
jan 1, 2005
3.054
+0.089
3.01%
jan 1, 2006
2.962
-0.092
-3.01%
jan 1, 2007
3.048
+0.086
2.91%
jan 1, 2008
3.109
+0.061
2.0%
jan 1, 2009
3.393
+0.285
9.15%
jan 1, 2010
3.541
+0.148
4.36%
jan 1, 2011
3.637
+0.095
2.69%
jan 1, 2012
3.441
-0.196
-5.39%
jan 1, 2013
3.553
+0.112
3.26%
jan 1, 2014
3.484
-0.069
-1.94%
jan 1, 2015
3.518
+0.034
0.98%
Ranking of countries by current statistics by years