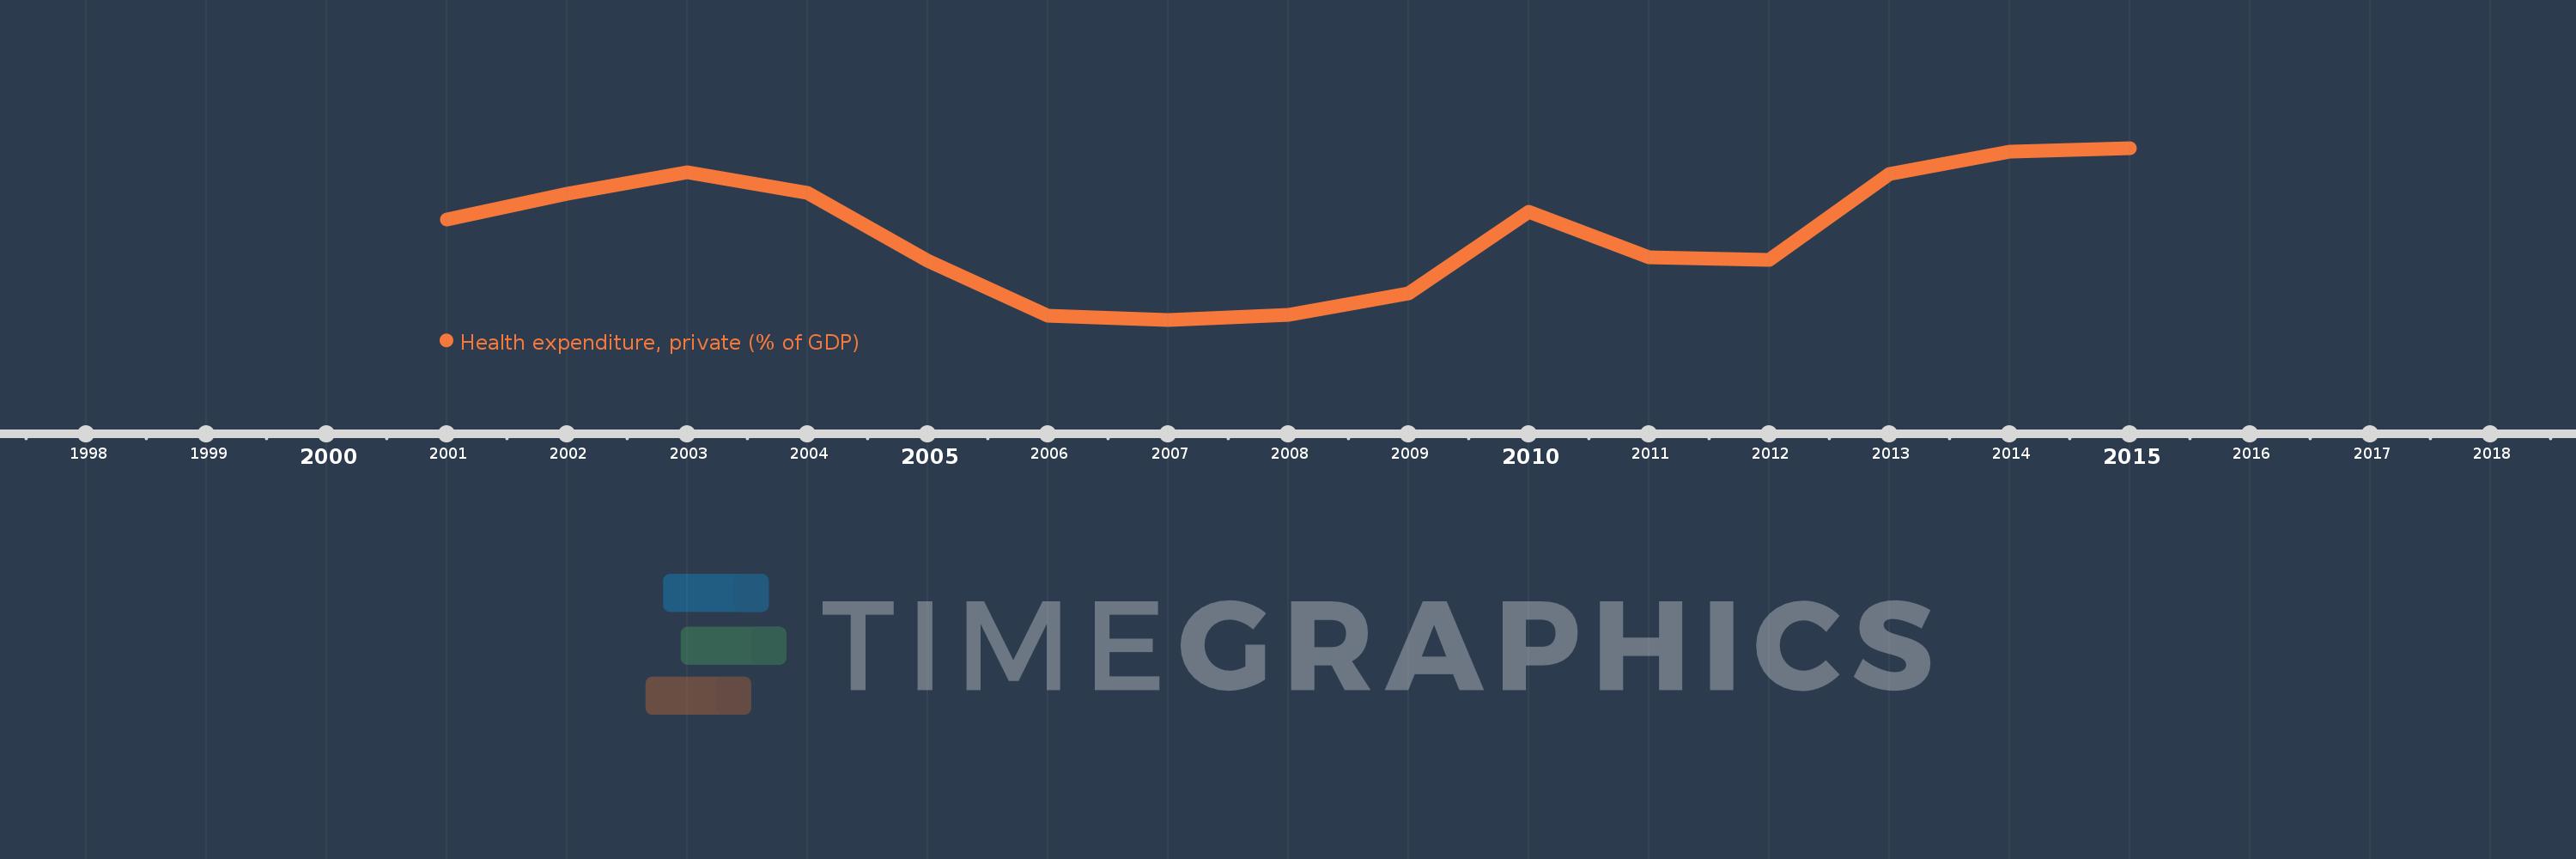
This timeline shows a graph from 2001 to 2015 of Fragile and conflict affected situations. No data until 2000. Number of actual observations by date: 15.
Source name:
World Development Indicators
Source organization:
World Health Organization Global Health Expenditure database (see http://apps.who.int/nha/database for the most recent updates).
Categories, topics:
Health
Last updated:
apr 23, 2017
Indicators value changes by year
Meaning:
2.824
Minimum:
2.381
jan 1, 2007
Maximum:
3.252
jan 1, 2015
At the date of observation
Value
Absolute change
Change from the previous value
jan 1, 2001
2.89
+2.89
0.0%
jan 1, 2002
3.022
+0.132
4.58%
jan 1, 2003
3.128
+0.106
3.49%
jan 1, 2004
3.023
-0.105
-3.34%
jan 1, 2005
2.681
-0.342
-11.32%
jan 1, 2006
2.4
-0.281
-10.49%
jan 1, 2007
2.381
-0.019
-0.77%
jan 1, 2008
2.406
+0.025
1.05%
jan 1, 2009
2.516
+0.11
4.57%
jan 1, 2010
2.927
+0.411
16.32%
jan 1, 2011
2.699
-0.228
-7.78%
jan 1, 2012
2.684
-0.015
-0.57%
jan 1, 2013
3.119
+0.435
16.2%
jan 1, 2014
3.233
+0.114
3.65%
jan 1, 2015
3.252
+0.019
0.58%
Ranking of countries by current statistics by years