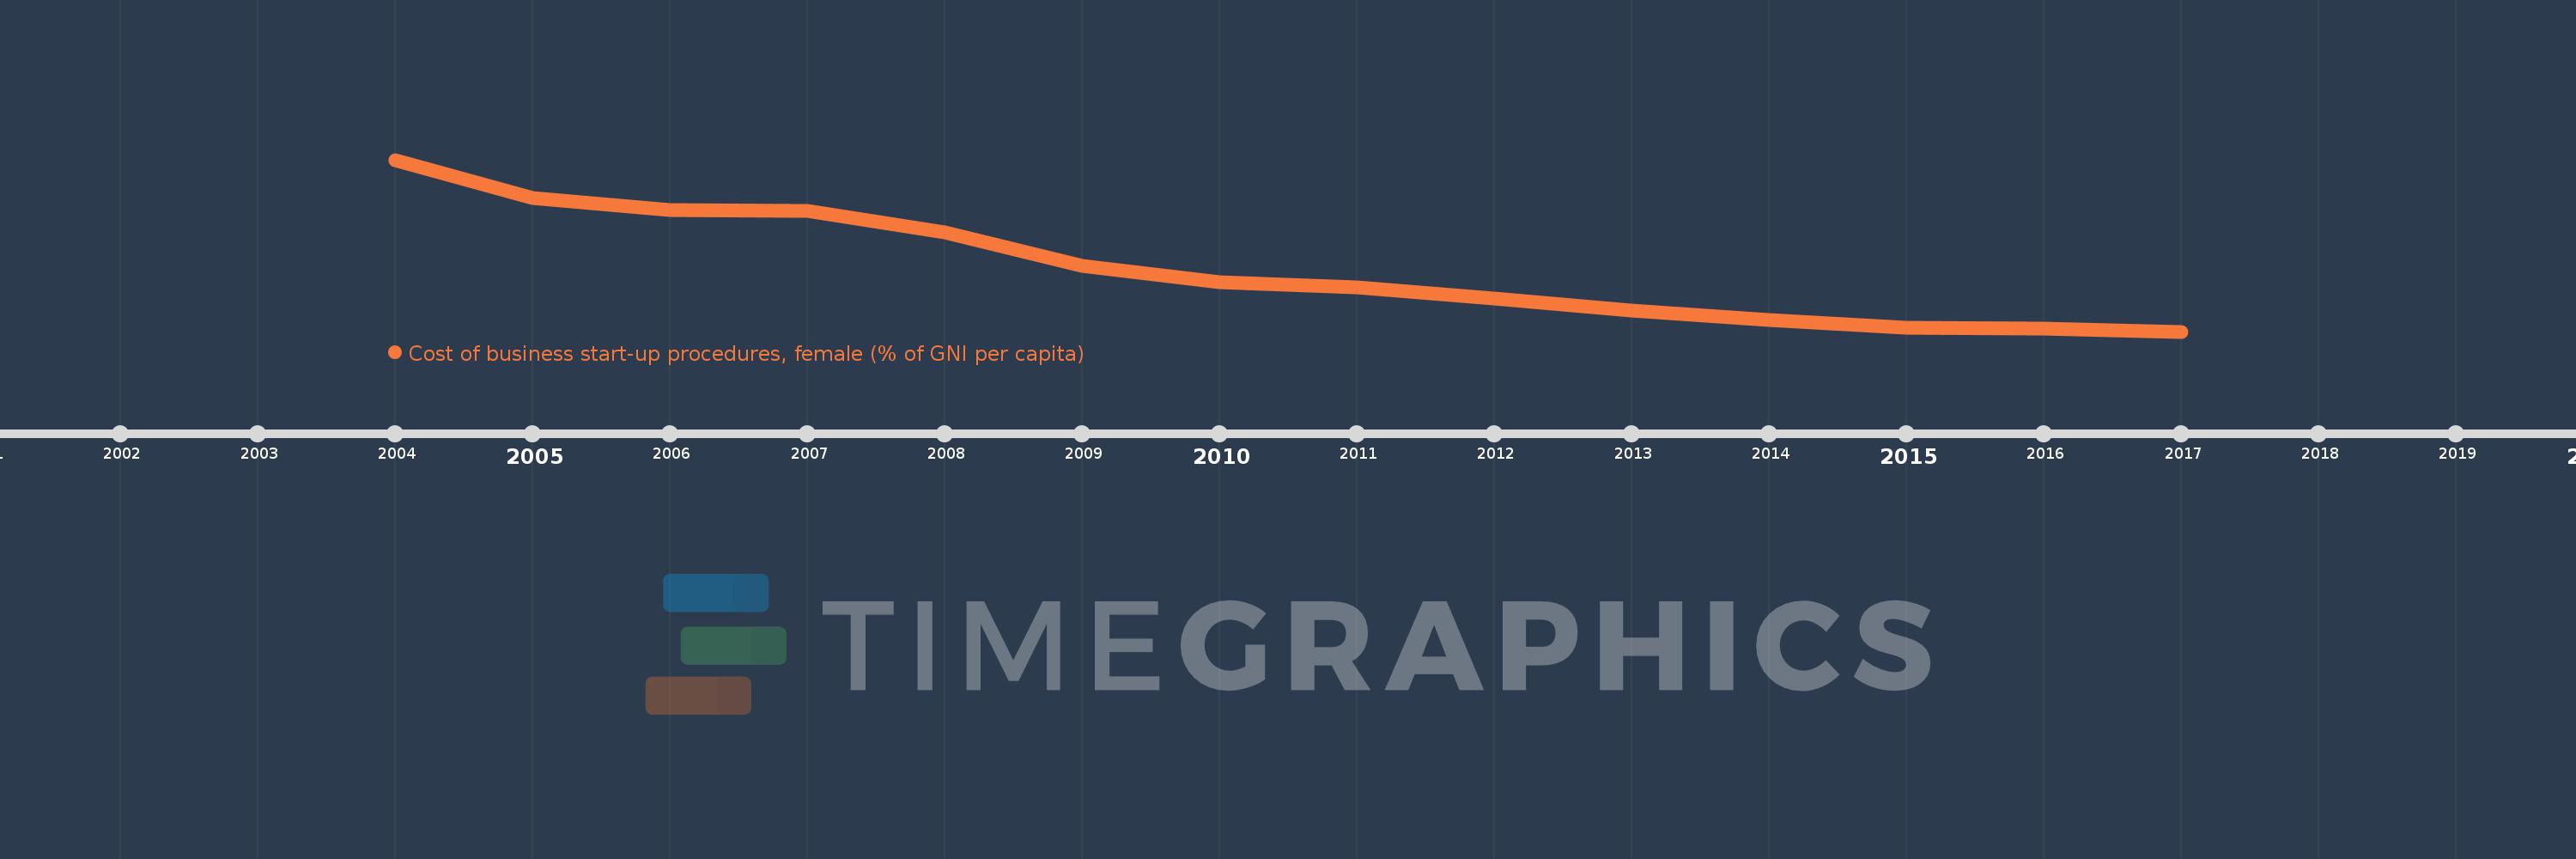
This timeline shows a graph from 2004 to 2017 of Heavily indebted poor countries (HIPC). No data until 2003. Number of actual observations by date: 14.
Source name:
World Development Indicators
Source organization:
World Bank, Doing Business project (http://www.doingbusiness.org/).
Categories, topics:
Private Sector
Last updated:
apr 23, 2017
Indicators value changes by year
Meaning:
144.303
Minimum:
56.472
jan 1, 2017
Maximum:
296.634
jan 1, 2004
At the date of observation
Value
Absolute change
Change from the previous value
jan 1, 2004
296.634
+296.634
0.0%
jan 1, 2005
243.303
-53.332
-17.98%
jan 1, 2006
225.916
-17.387
-7.15%
jan 1, 2007
224.708
-1.208
-0.53%
jan 1, 2008
195.763
-28.945
-12.88%
jan 1, 2009
148.639
-47.124
-24.07%
jan 1, 2010
125.713
-22.926
-15.42%
jan 1, 2011
117.845
-7.868
-6.26%
jan 1, 2012
103.218
-14.626
-12.41%
jan 1, 2013
85.468
-17.75
-17.2%
jan 1, 2014
73.005
-12.463
-14.58%
jan 1, 2015
62.455
-10.55
-14.45%
jan 1, 2016
61.103
-1.353
-2.17%
jan 1, 2017
56.472
-4.631
-7.58%
Ranking of countries by current statistics by years