33
/
AIzaSyB4mHJ5NPEv-XzF7P6NDYXjlkCWaeKw5bc
November 30, 2025
32474
Europe & Central Asia (IDA & IBRD countries)
TEC
false
2
1
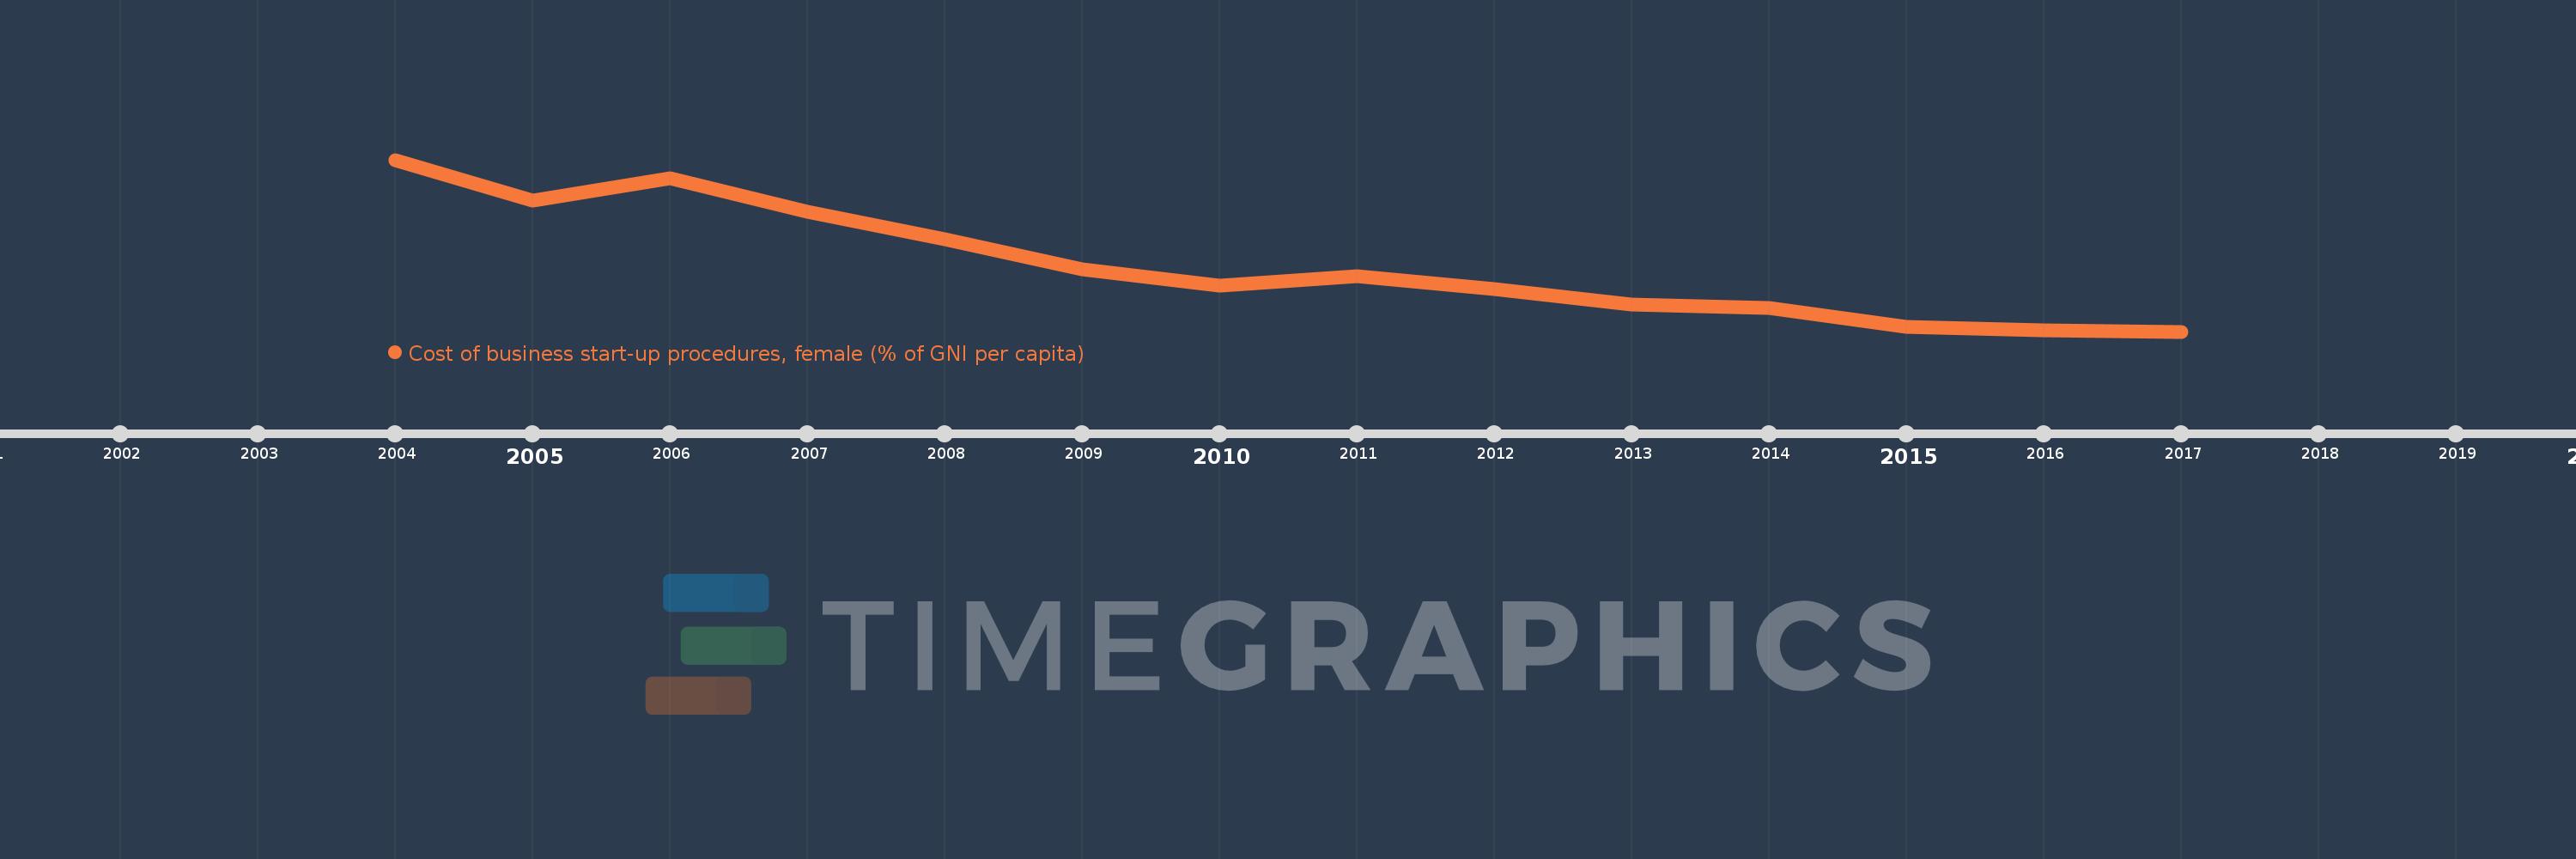
Cost of business start-up procedures, female (% of GNI per capita)
2017,2016,2015,2014,2013,2012,2011,2010,2009,2008,2007,2006,2005,2004