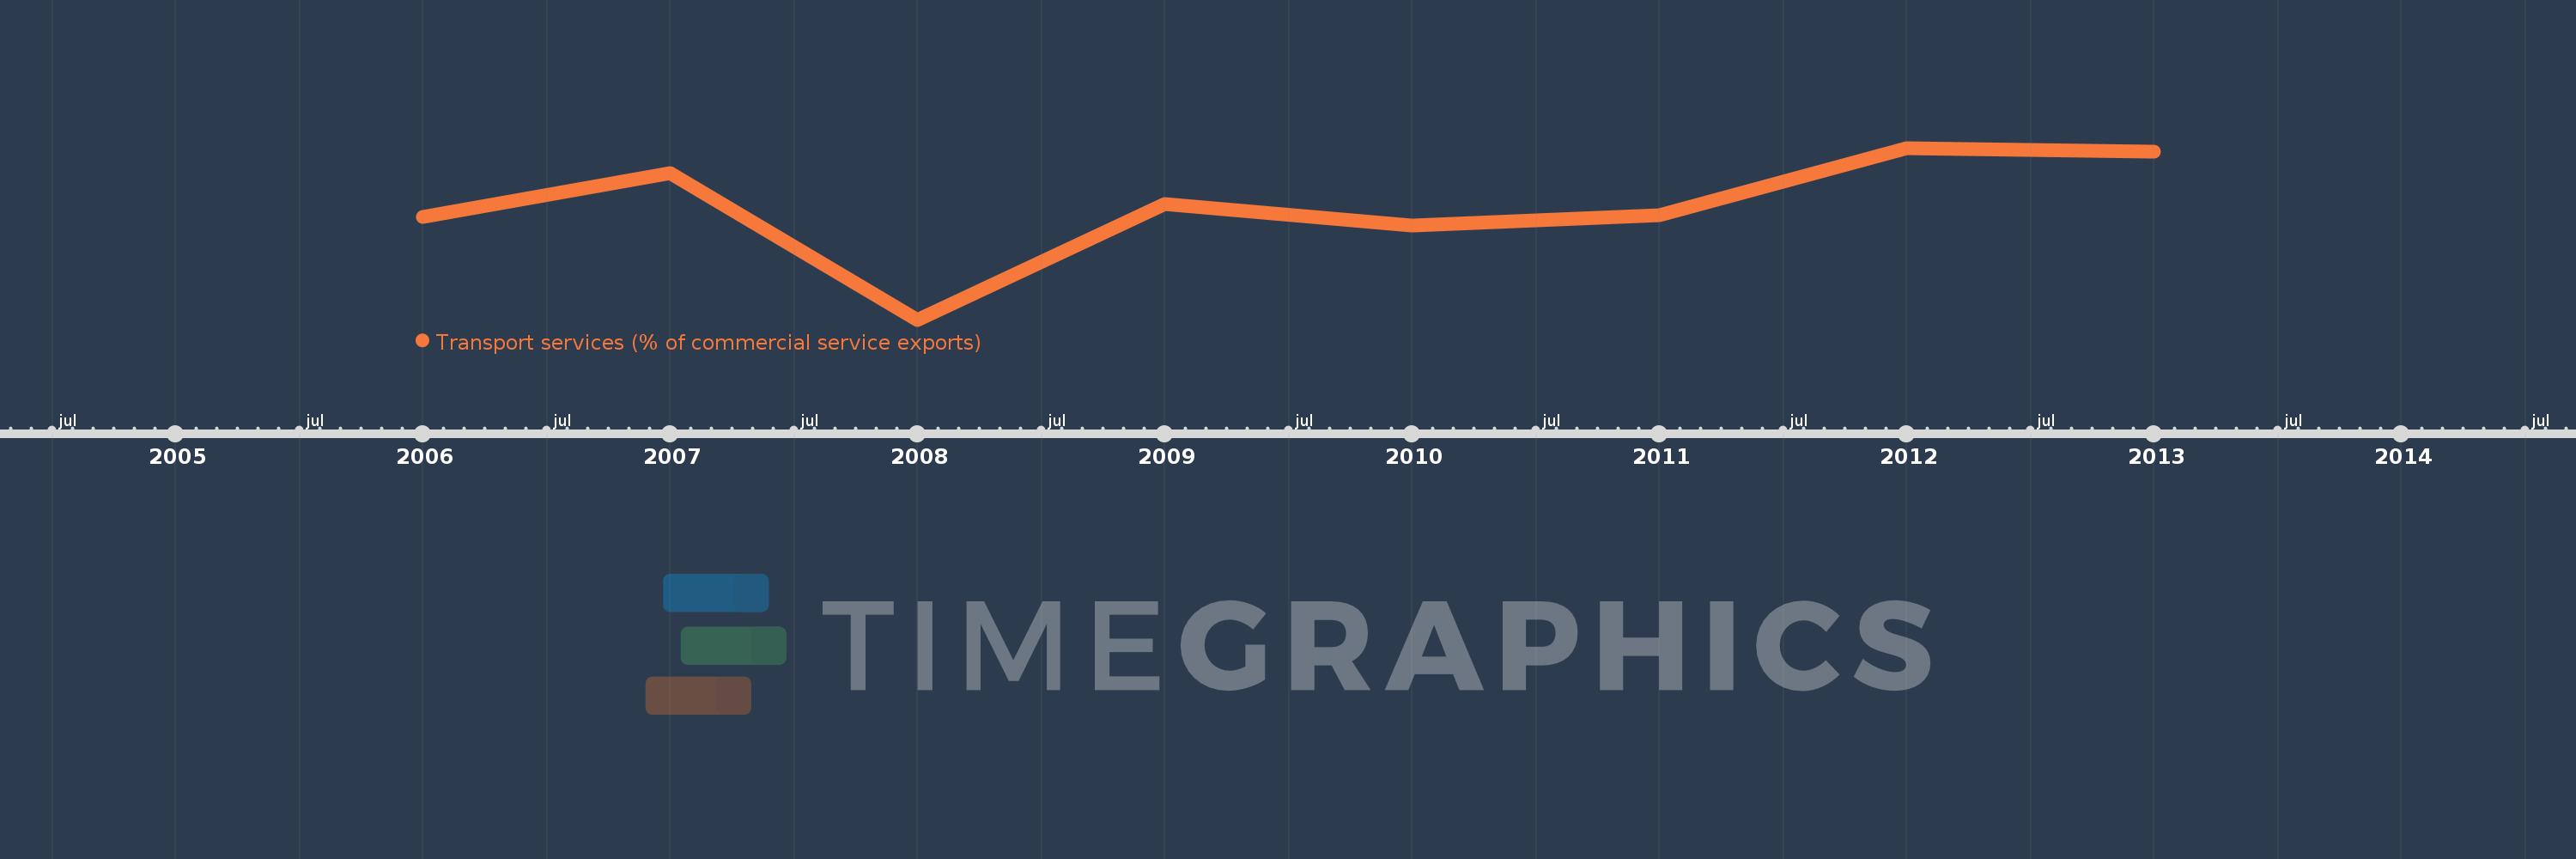
This timeline shows a graph from 2006 to 2013 of Fragile and conflict affected situations. No data until 2005. Number of actual observations by date: 8.
Source name:
World Development Indicators
Source organization:
International Monetary Fund, Balance of Payments Statistics Yearbook and data files.
Categories, topics:
Private Sector, Trade
Last updated:
apr 23, 2017
Indicators value changes by year
Meaning:
30.492
Minimum:
21.365
jan 1, 2008
Maximum:
35.239
jan 1, 2012
At the date of observation
Value
Absolute change
Change from the previous value
jan 1, 2006
29.701
+29.701
0.0%
jan 1, 2007
33.211
+3.51
11.82%
jan 1, 2008
21.365
-11.846
-35.67%
jan 1, 2009
30.682
+9.317
43.61%
jan 1, 2010
28.958
-1.724
-5.62%
jan 1, 2011
29.833
+0.875
3.02%
jan 1, 2012
35.239
+5.406
18.12%
jan 1, 2013
34.951
-0.288
-0.82%
Ranking of countries by current statistics by years