33
/
AIzaSyB4mHJ5NPEv-XzF7P6NDYXjlkCWaeKw5bc
November 30, 2025
235231
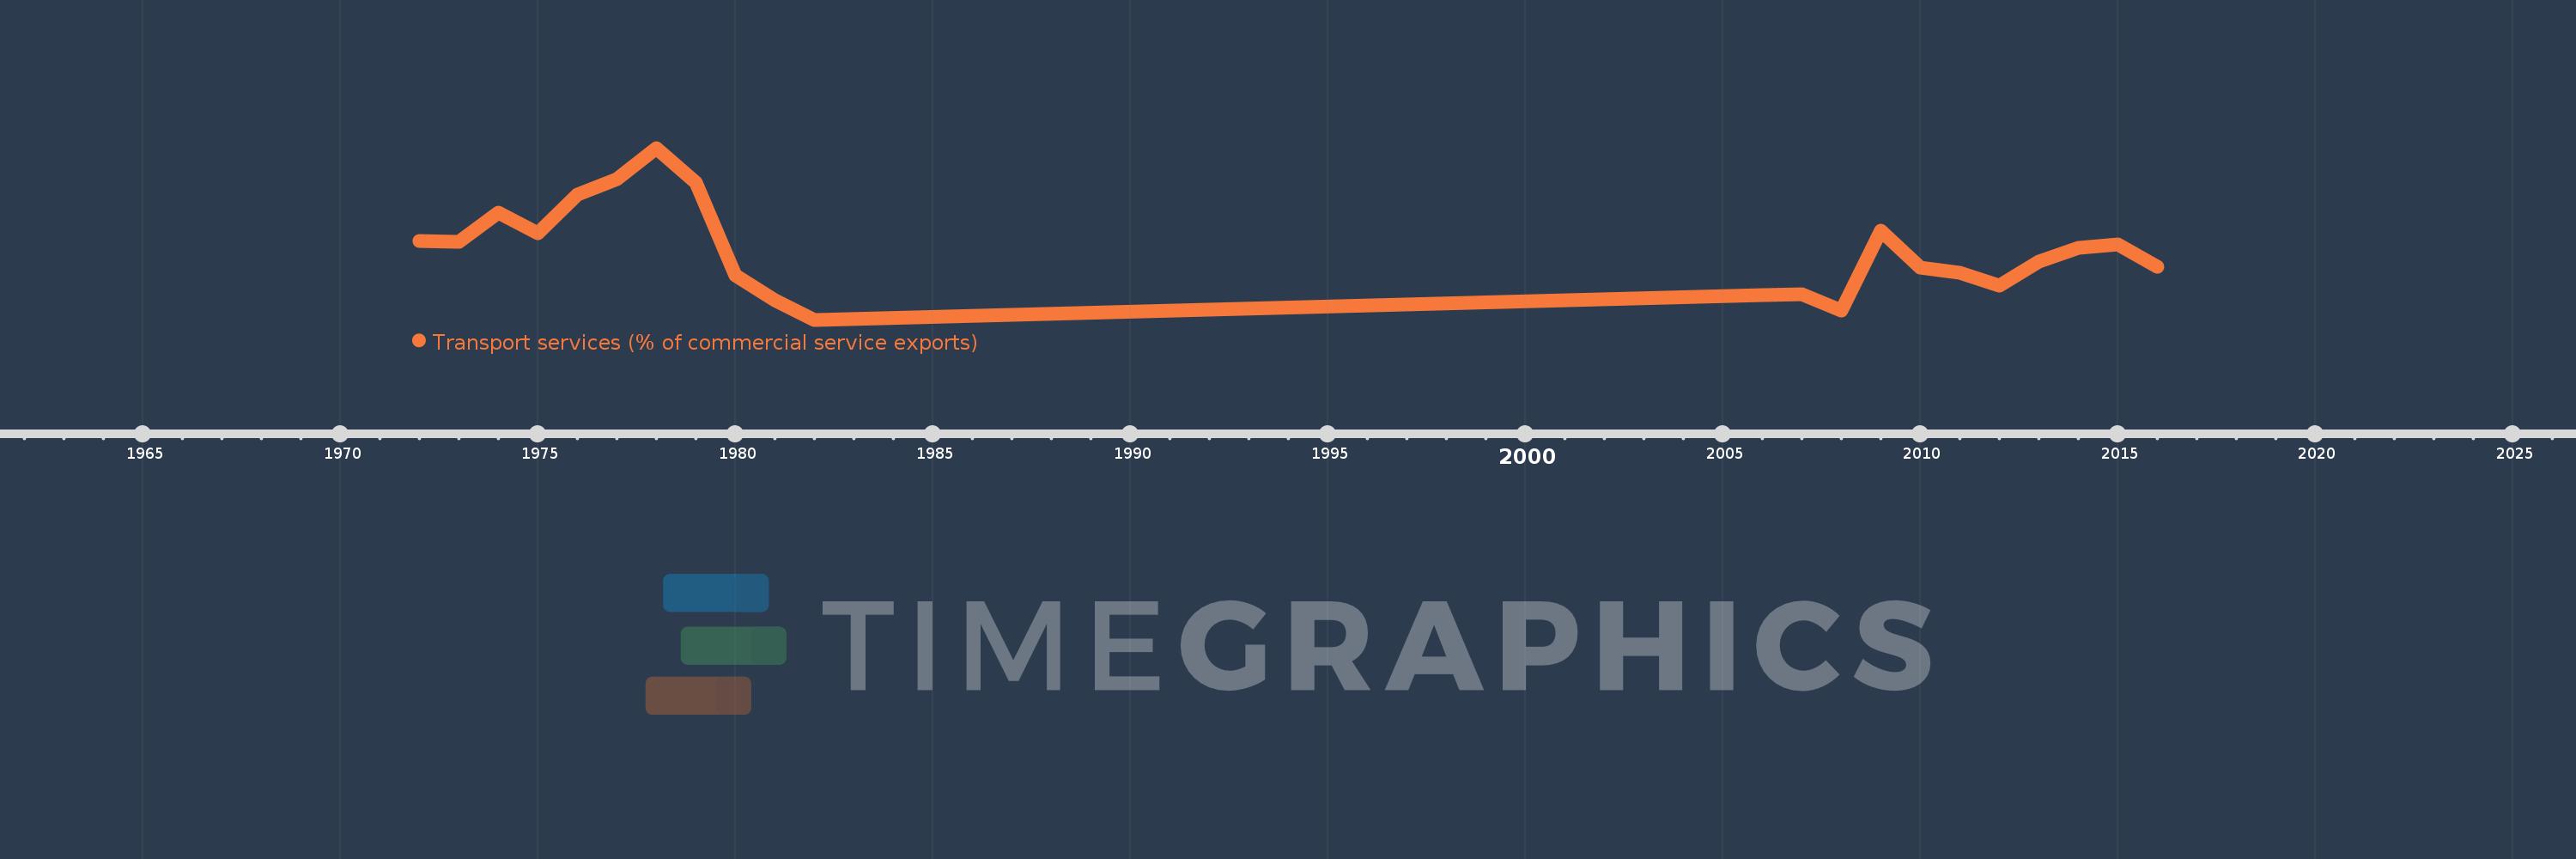
Saudi Arabia
SAU
true
2
1
Transport services (% of commercial service exports)
2016,2015,2014,2013,2012,2011,2010,2009,2008,2007,2006,1982,1981,1980,1979,1978,1977,1976,1975,1974,1973,1972