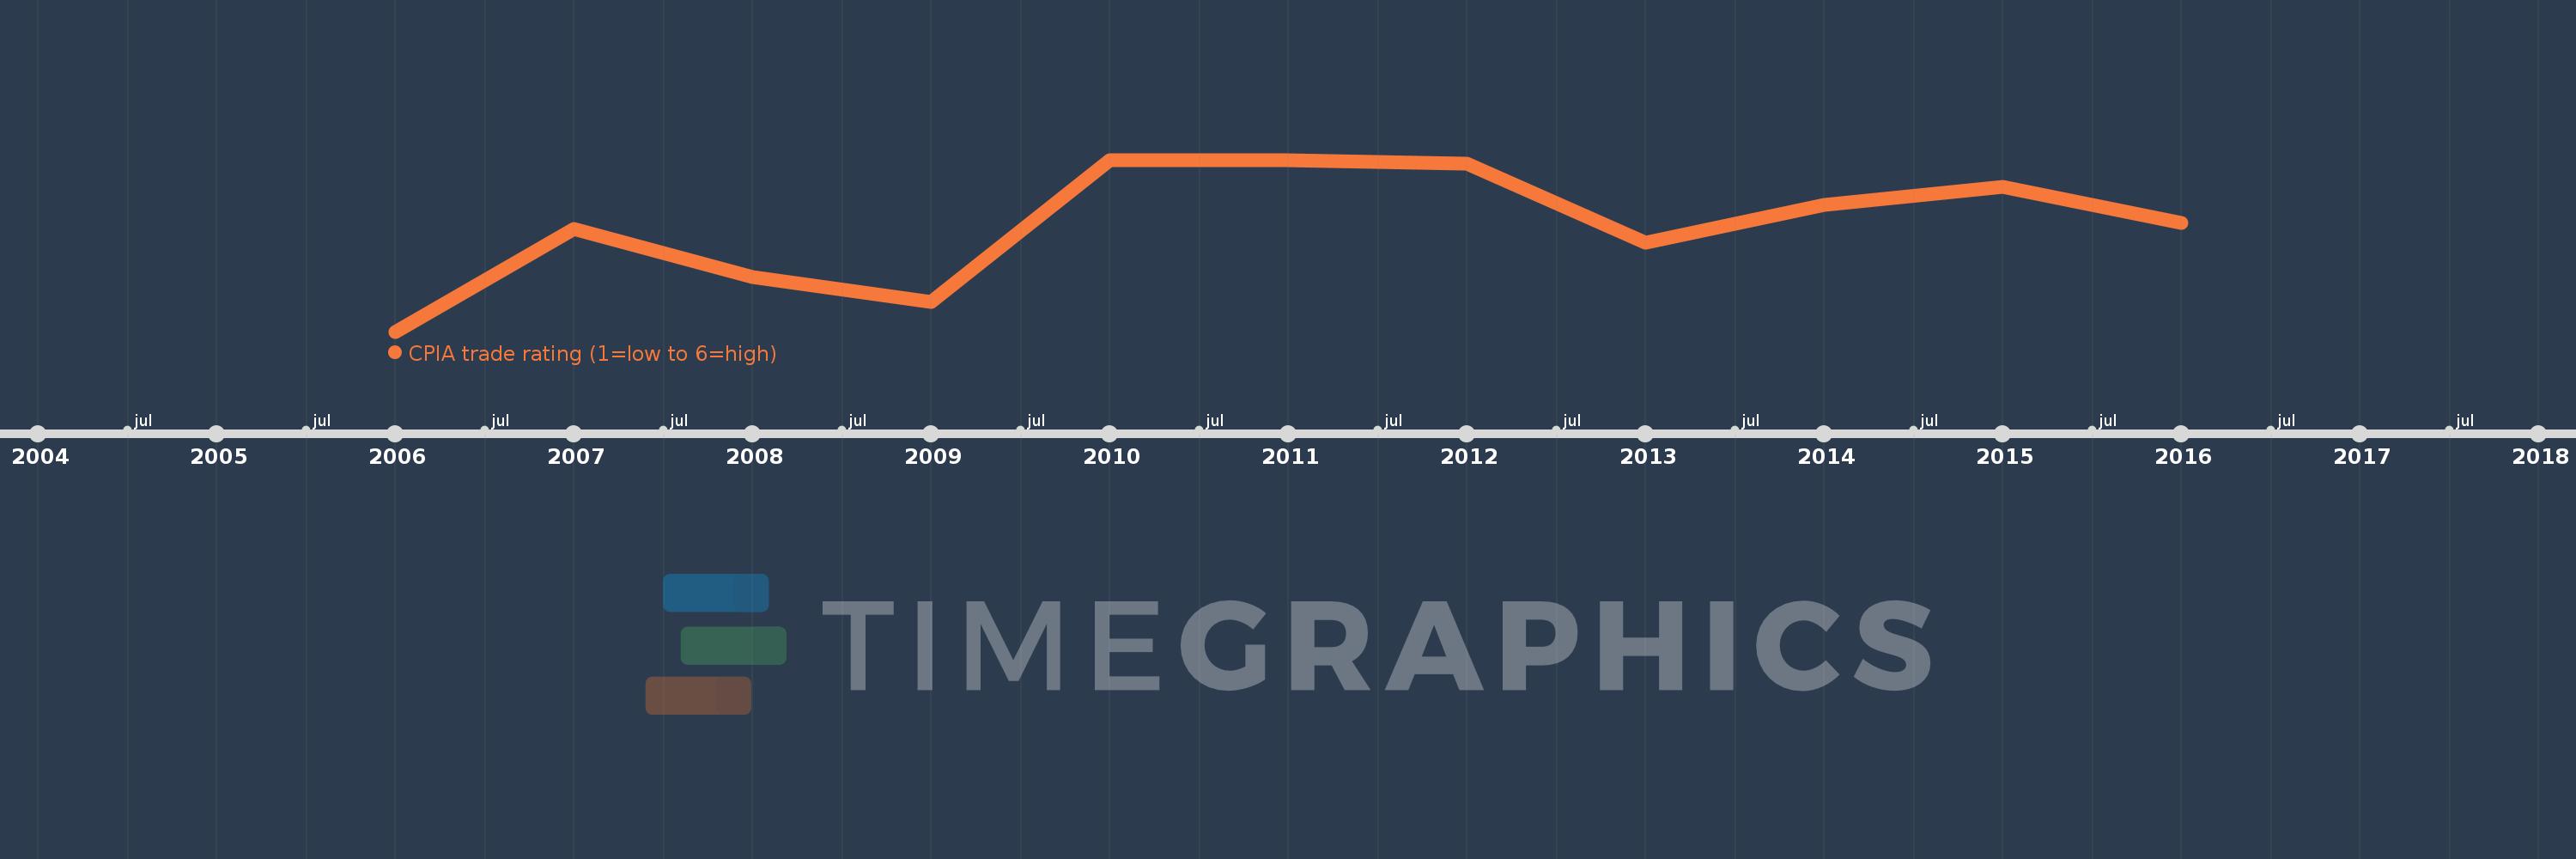
This timeline shows a graph from 2006 to 2016 of Fragile and conflict affected situations. No data until 2005. Number of actual observations by date: 11.
Source name:
World Development Indicators
Source organization:
World Bank Group, CPIA database (http://www.worldbank.org/ida).
Categories, topics:
Public Sector
Last updated:
apr 23, 2017
Indicators value changes by year
Meaning:
3.48
Minimum:
3.381
jan 1, 2006
Maximum:
3.542
jan 1, 2010
At the date of observation
Value
Absolute change
Change from the previous value
jan 1, 2006
3.381
+3.381
0.0%
jan 1, 2007
3.477
+0.096
2.85%
jan 1, 2008
3.432
-0.045
-1.31%
jan 1, 2009
3.409
-0.023
-0.66%
jan 1, 2010
3.542
+0.133
3.89%
jan 1, 2011
3.542
0.0
0.0%
jan 1, 2012
3.538
-0.003
-0.09%
jan 1, 2013
3.464
-0.074
-2.1%
jan 1, 2014
3.5
+0.036
1.03%
jan 1, 2015
3.517
+0.017
0.49%
jan 1, 2016
3.483
-0.034
-0.98%
Ranking of countries by current statistics by years