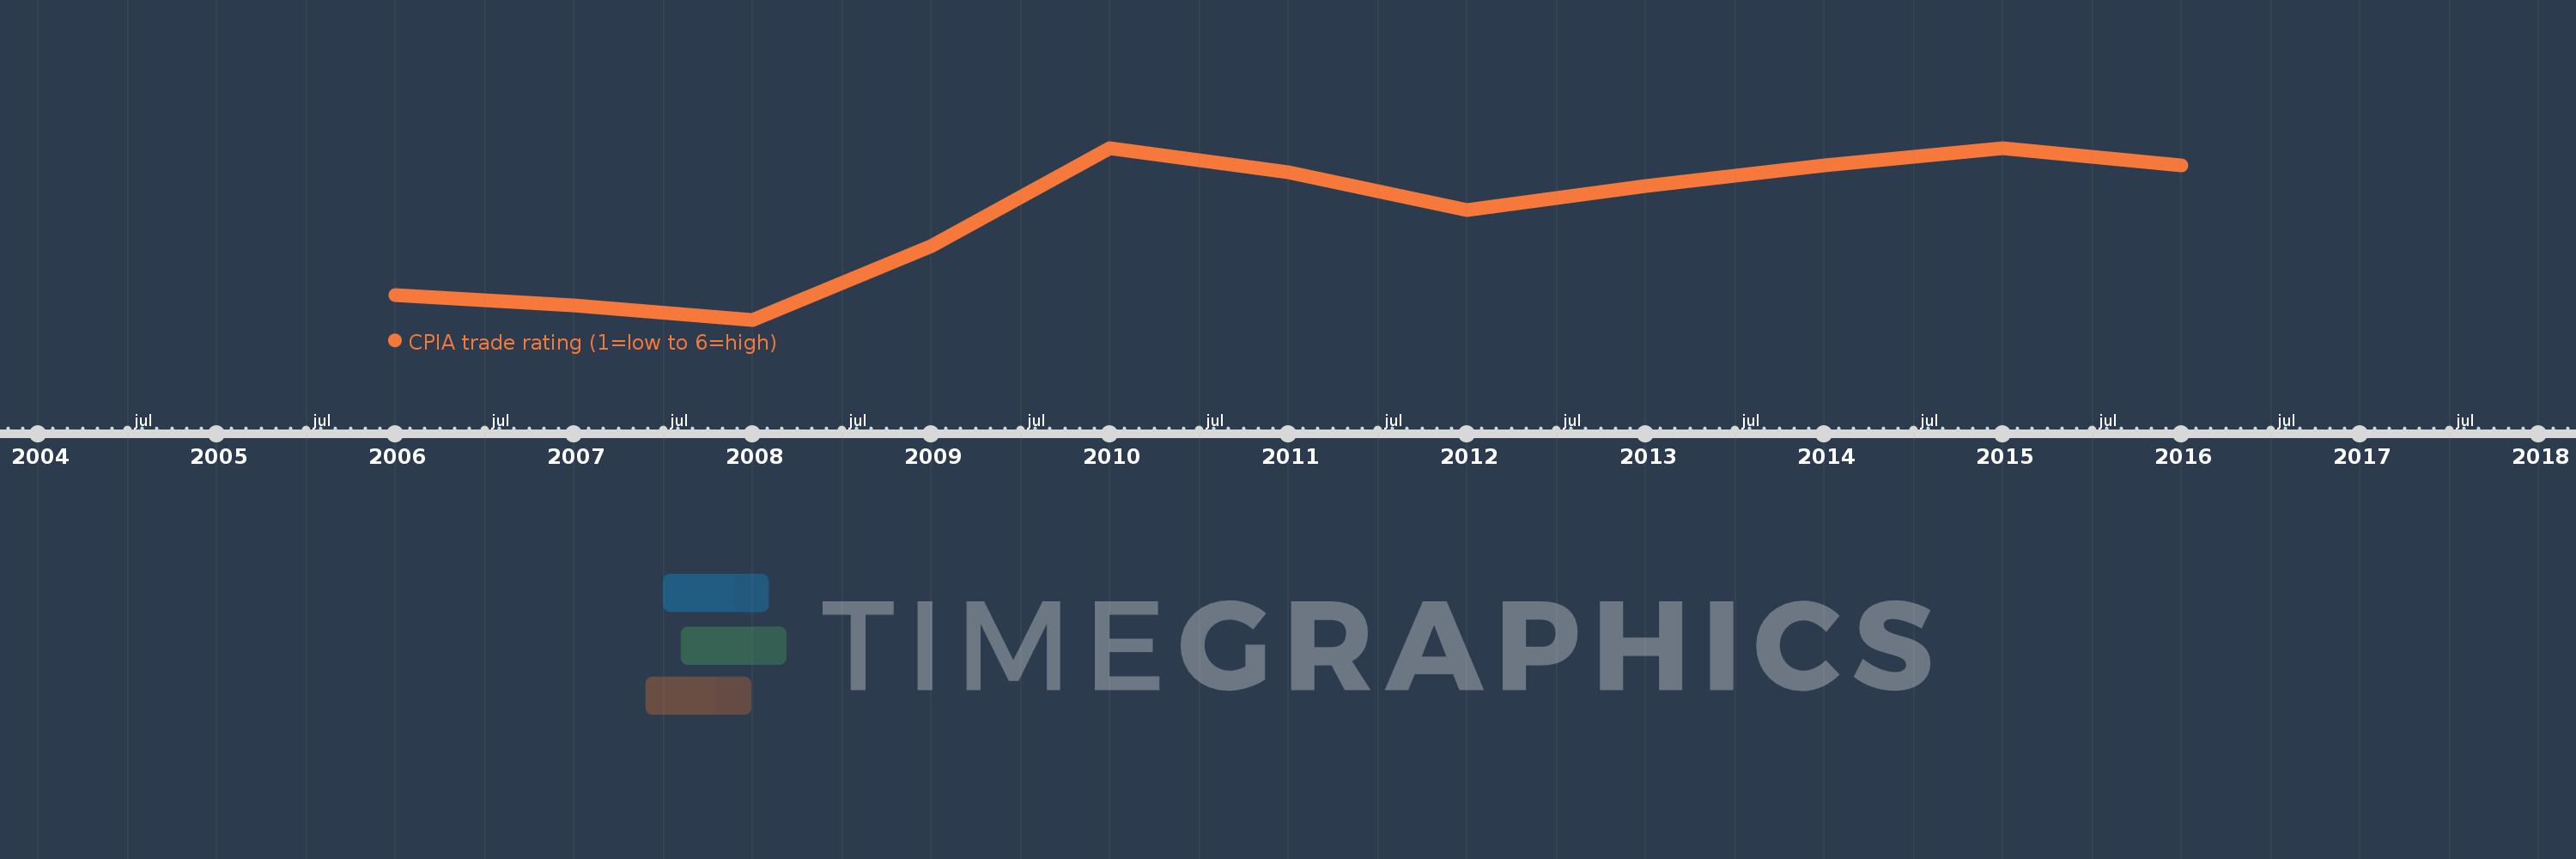
This timeline shows a graph from 2006 to 2016 of East Asia & Pacific (IDA & IBRD countries). No data until 2005. Number of actual observations by date: 11.
Source name:
World Development Indicators
Source organization:
World Bank Group, CPIA database (http://www.worldbank.org/ida).
Categories, topics:
Public Sector
Last updated:
apr 23, 2017
Indicators value changes by year
Meaning:
3.876
Minimum:
3.682
jan 1, 2008
Maximum:
4.0
jan 1, 2010
At the date of observation
Value
Absolute change
Change from the previous value
jan 1, 2006
3.727
+3.727
0.0%
jan 1, 2007
3.708
-0.019
-0.51%
jan 1, 2008
3.682
-0.027
-0.72%
jan 1, 2009
3.818
+0.136
3.7%
jan 1, 2010
4.0
+0.182
4.76%
jan 1, 2011
3.955
-0.045
-1.14%
jan 1, 2012
3.885
-0.07
-1.77%
jan 1, 2013
3.929
+0.044
1.13%
jan 1, 2014
3.967
+0.038
0.97%
jan 1, 2015
4.0
+0.033
0.84%
jan 1, 2016
3.967
-0.033
-0.83%
Ranking of countries by current statistics by years