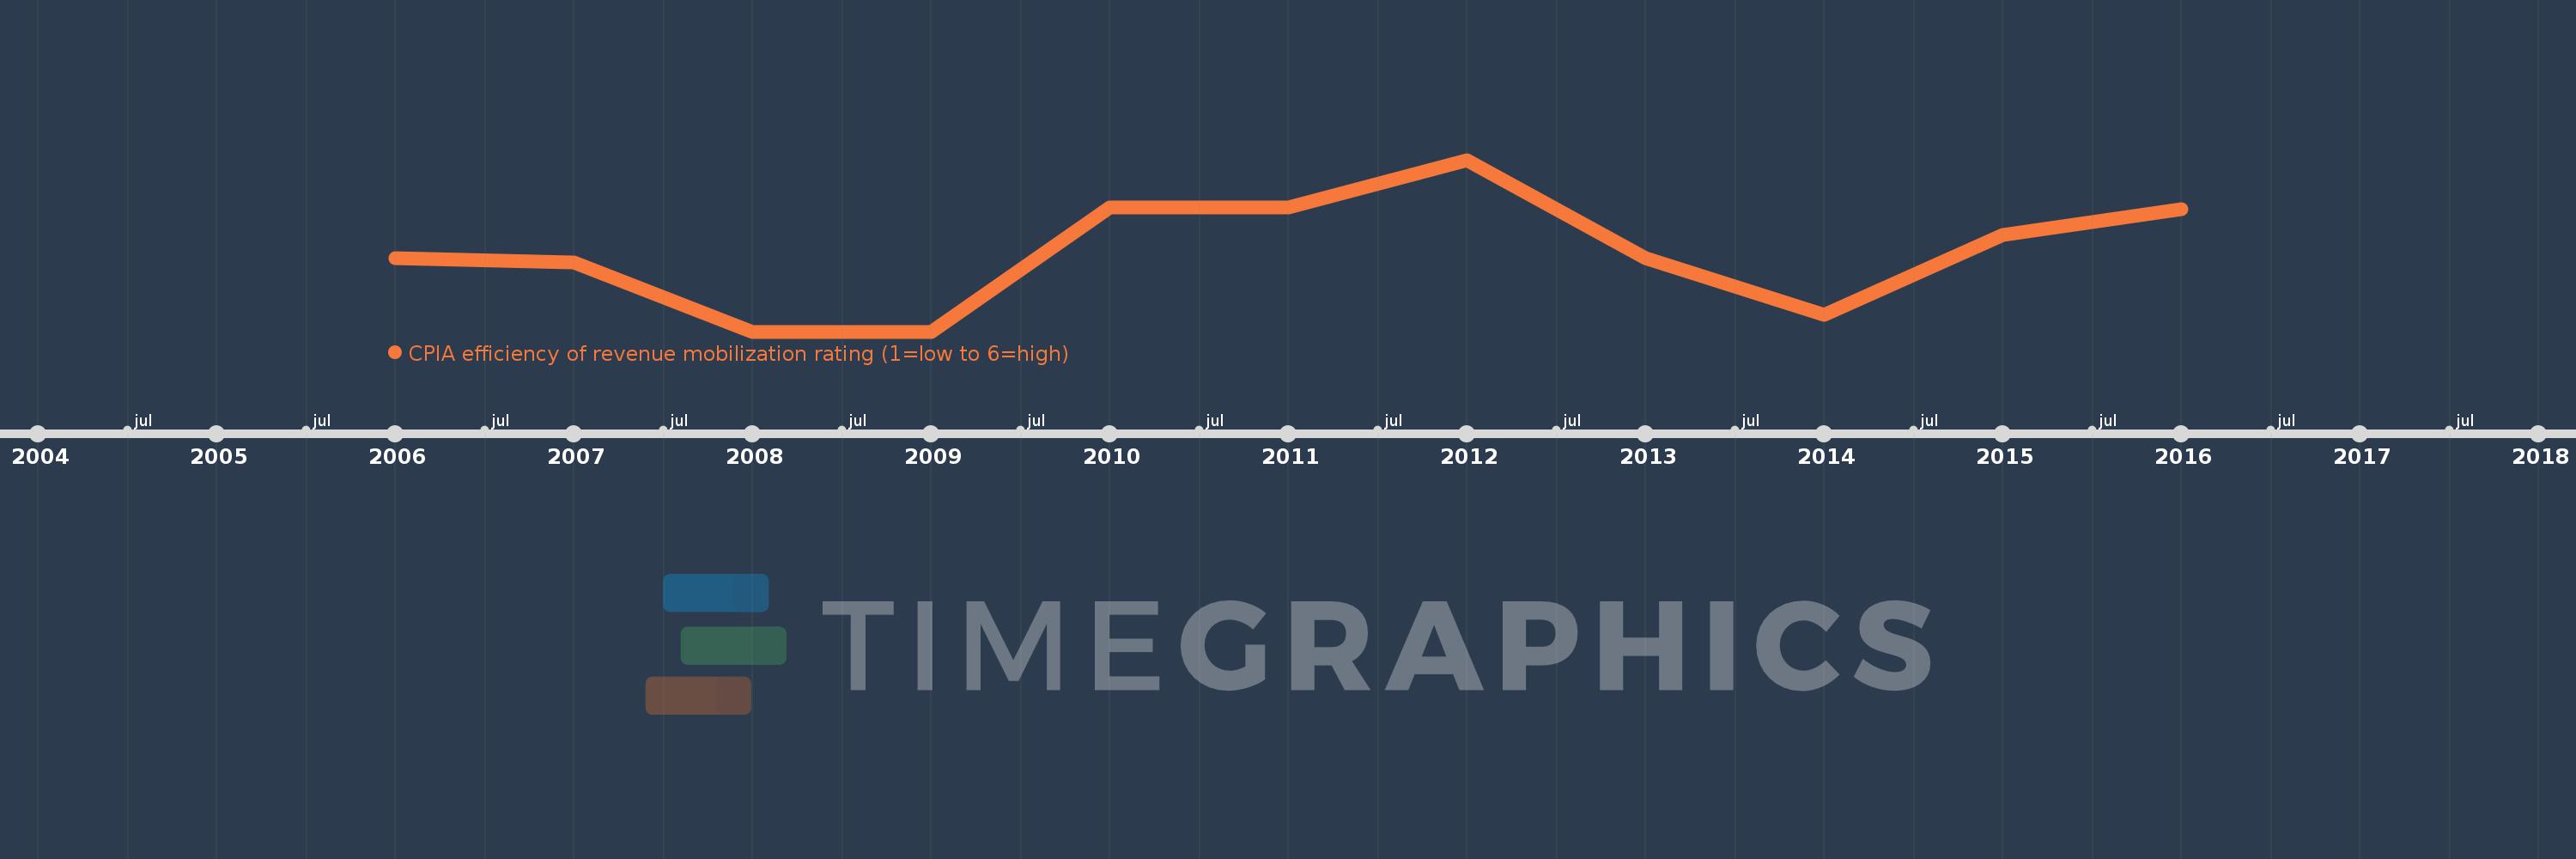
This timeline shows a graph from 2006 to 2016 of Fragile and conflict affected situations. No data until 2005. Number of actual observations by date: 11.
Source name:
World Development Indicators
Source organization:
World Bank Group, CPIA database (http://www.worldbank.org/ida).
Categories, topics:
Public Sector
Last updated:
apr 23, 2017
Indicators value changes by year
Meaning:
3.075
Minimum:
3.023
jan 1, 2008
Maximum:
3.135
jan 1, 2012
At the date of observation
Value
Absolute change
Change from the previous value
jan 1, 2006
3.071
+3.071
0.0%
jan 1, 2007
3.068
-0.003
-0.11%
jan 1, 2008
3.023
-0.045
-1.48%
jan 1, 2009
3.023
0.0
0.0%
jan 1, 2010
3.104
+0.081
2.69%
jan 1, 2011
3.104
0.0
0.0%
jan 1, 2012
3.135
+0.03
0.98%
jan 1, 2013
3.071
-0.063
-2.02%
jan 1, 2014
3.034
-0.037
-1.2%
jan 1, 2015
3.086
+0.052
1.7%
jan 1, 2016
3.103
+0.017
0.56%
Ranking of countries by current statistics by years