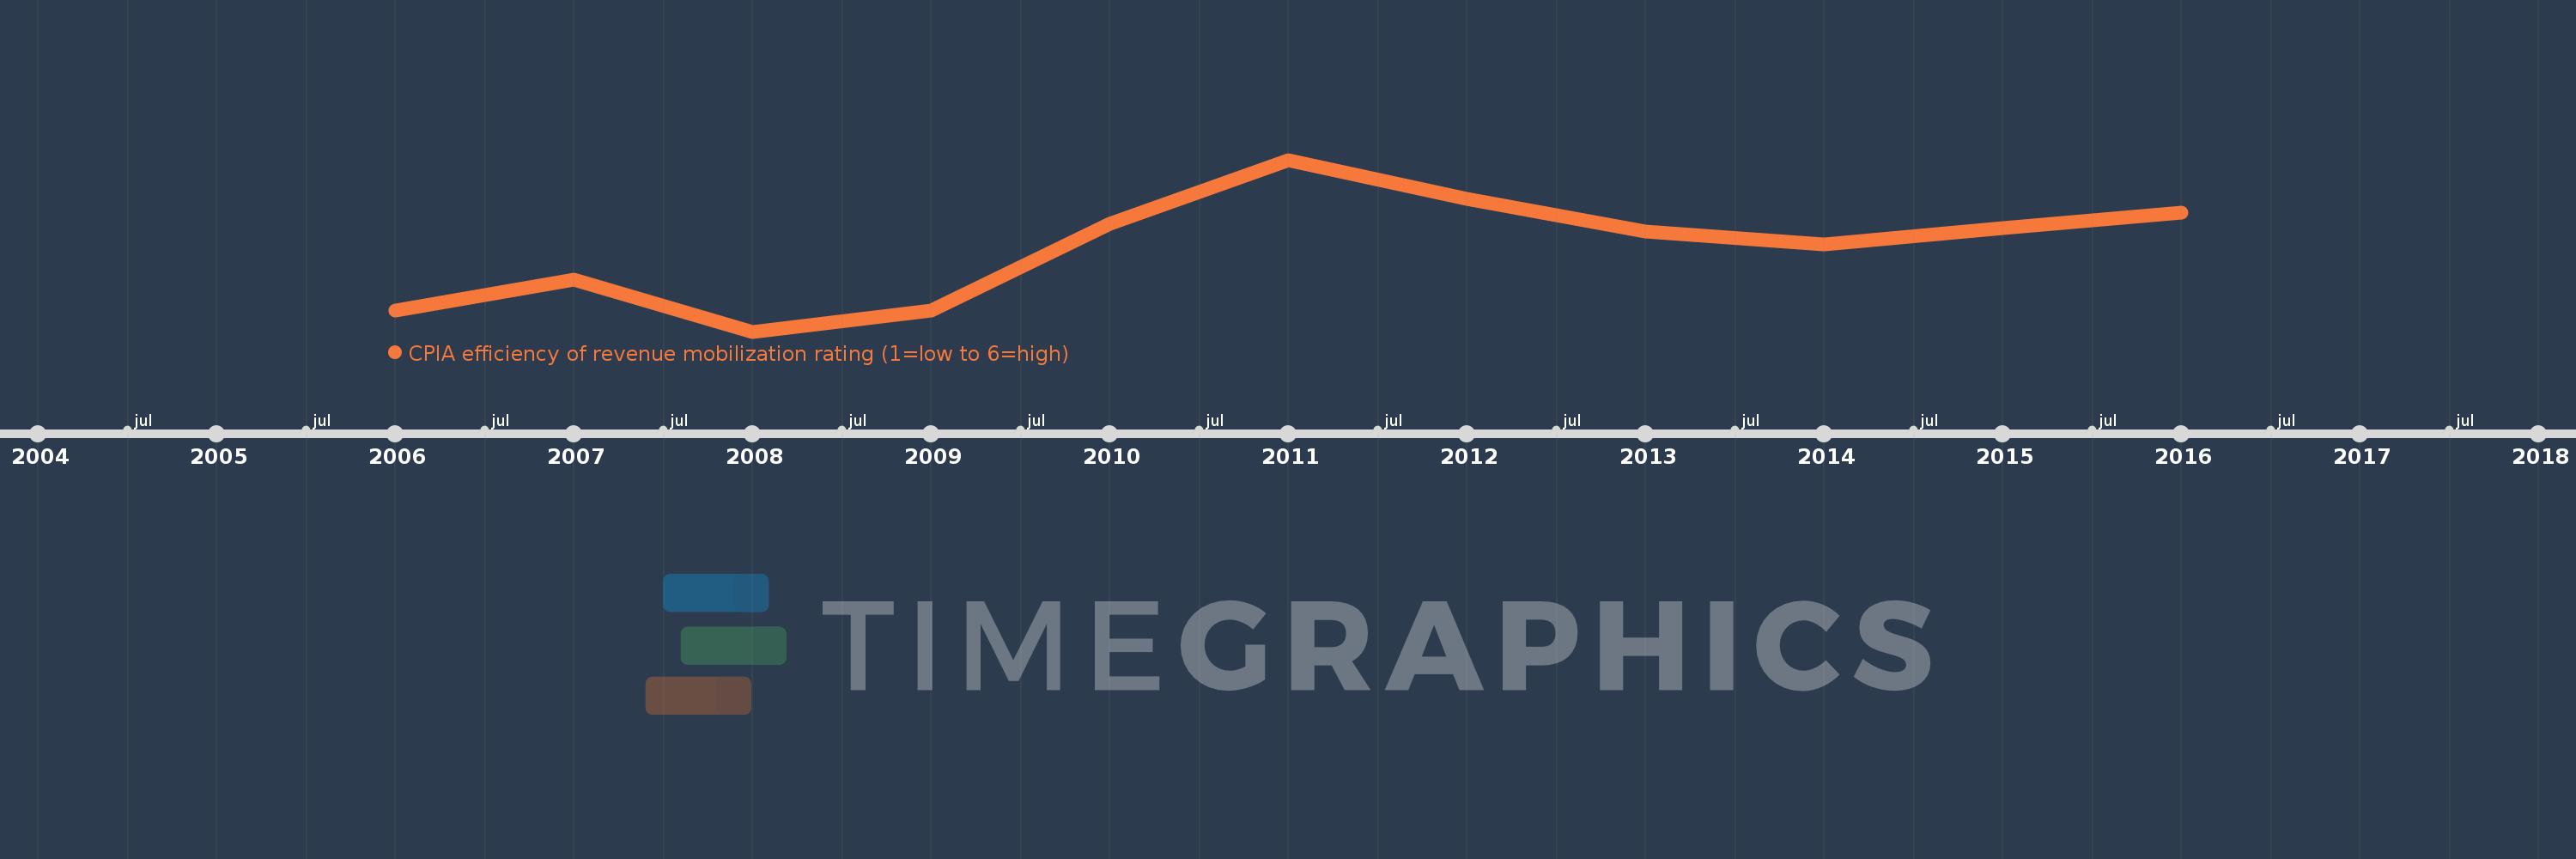
This timeline shows a graph from 2006 to 2016 of East Asia & Pacific (excluding high income). No data until 2005. Number of actual observations by date: 11.
Source name:
World Development Indicators
Source organization:
World Bank Group, CPIA database (http://www.worldbank.org/ida).
Categories, topics:
Public Sector
Last updated:
apr 23, 2017
Indicators value changes by year
Meaning:
3.358
Minimum:
3.182
jan 1, 2008
Maximum:
3.545
jan 1, 2011
At the date of observation
Value
Absolute change
Change from the previous value
jan 1, 2006
3.227
+3.227
0.0%
jan 1, 2007
3.292
+0.064
2.0%
jan 1, 2008
3.182
-0.11
-3.34%
jan 1, 2009
3.227
+0.045
1.43%
jan 1, 2010
3.409
+0.182
5.63%
jan 1, 2011
3.545
+0.136
4.0%
jan 1, 2012
3.462
-0.084
-2.37%
jan 1, 2013
3.393
-0.069
-1.98%
jan 1, 2014
3.367
-0.026
-0.77%
jan 1, 2015
3.4
+0.033
0.99%
jan 1, 2016
3.433
+0.033
0.98%
Ranking of countries by current statistics by years