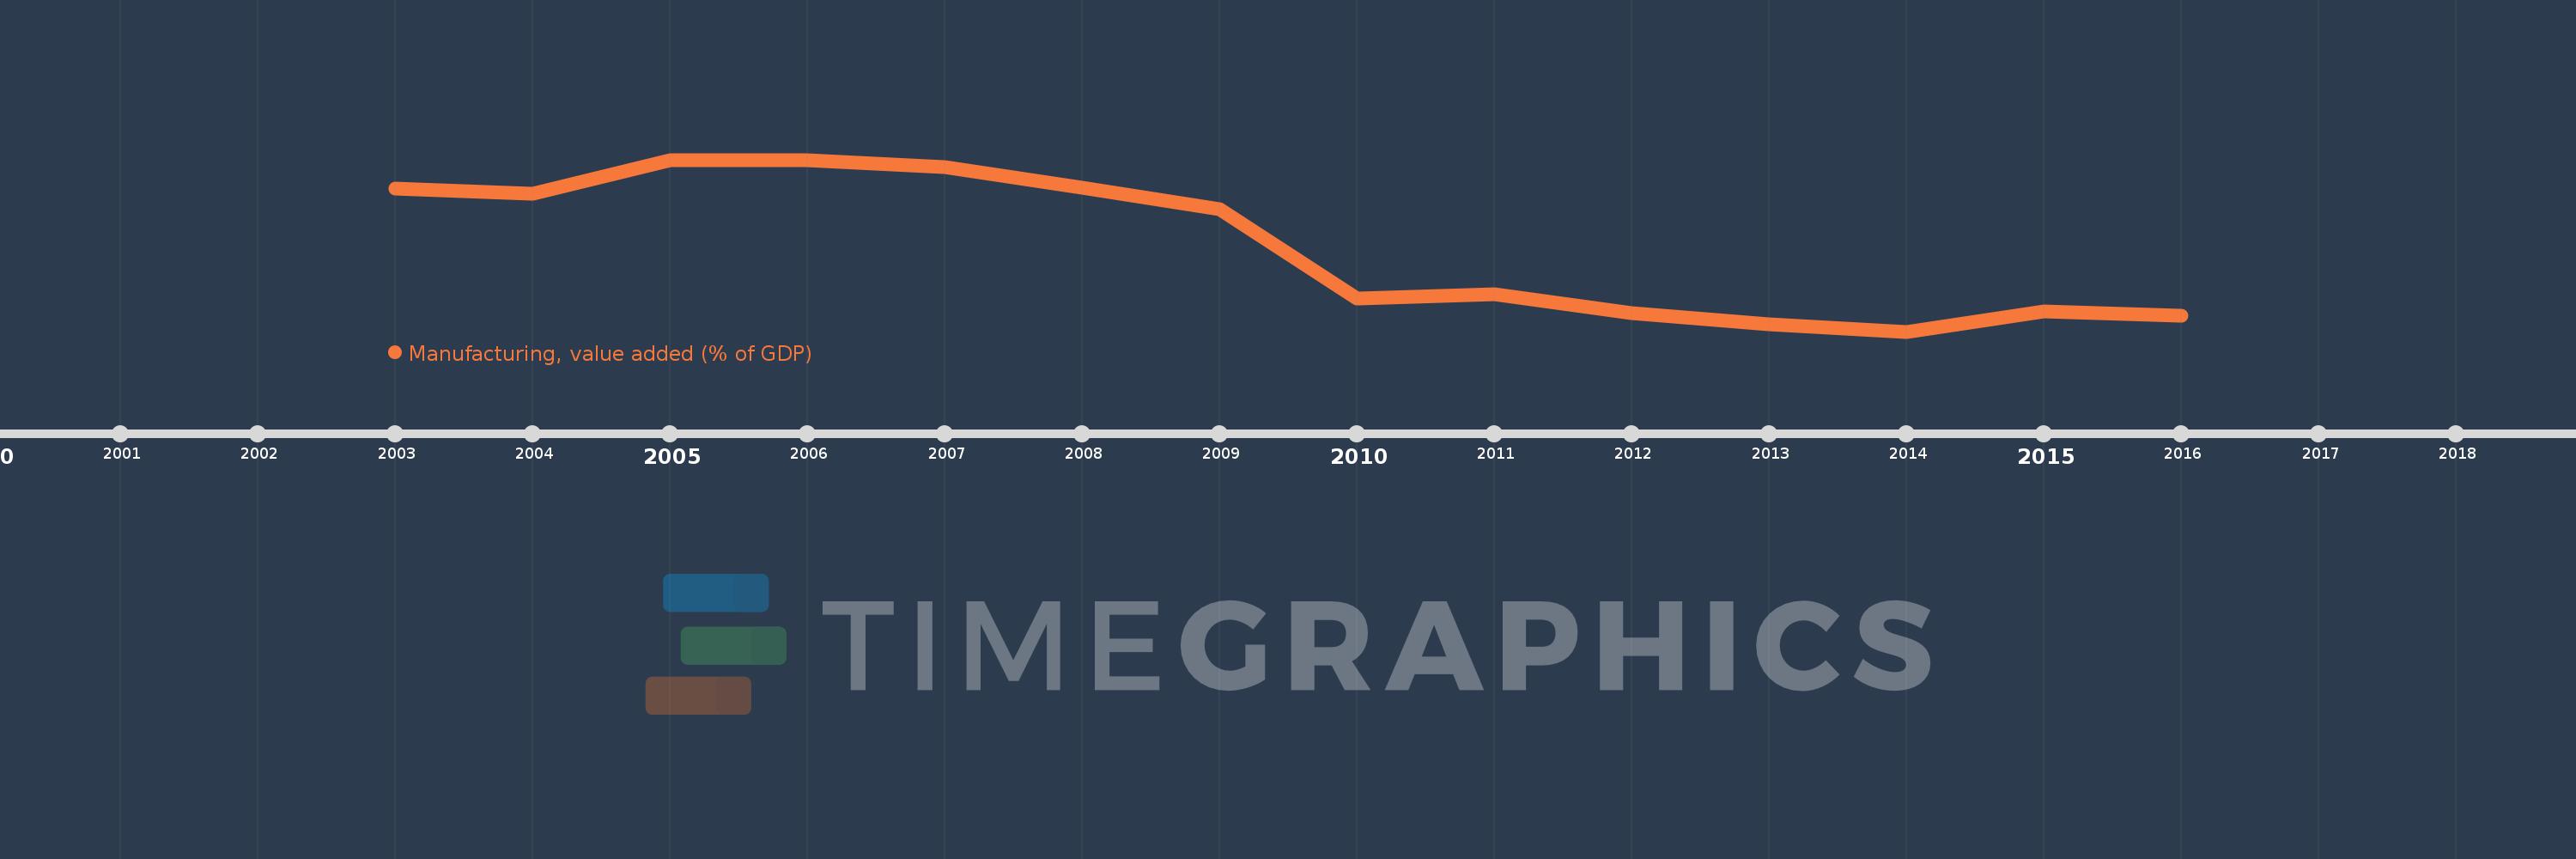
This timeline shows a graph from 2003 to 2016 of Europe & Central Asia (IDA & IBRD countries). No data until 2002. Number of actual observations by date: 14.
Source name:
World Development Indicators
Source organization:
World Bank national accounts data, and OECD National Accounts data files.
Categories, topics:
Economy & Growth
Last updated:
apr 23, 2017
Indicators value changes by year
Meaning:
16.919
Minimum:
15.379
jan 1, 2014
Maximum:
18.498
jan 1, 2005
At the date of observation
Value
Absolute change
Change from the previous value
jan 1, 2003
17.97
+17.97
0.0%
jan 1, 2004
17.876
-0.094
-0.52%
jan 1, 2005
18.498
+0.622
3.48%
jan 1, 2006
18.495
-0.004
-0.02%
jan 1, 2007
18.361
-0.134
-0.72%
jan 1, 2008
17.995
-0.365
-1.99%
jan 1, 2009
17.602
-0.393
-2.18%
jan 1, 2010
15.982
-1.62
-9.2%
jan 1, 2011
16.064
+0.082
0.51%
jan 1, 2012
15.712
-0.352
-2.19%
jan 1, 2013
15.519
-0.193
-1.23%
jan 1, 2014
15.379
-0.14
-0.9%
jan 1, 2015
15.745
+0.366
2.38%
jan 1, 2016
15.663
-0.082
-0.52%
Ranking of countries by current statistics by years