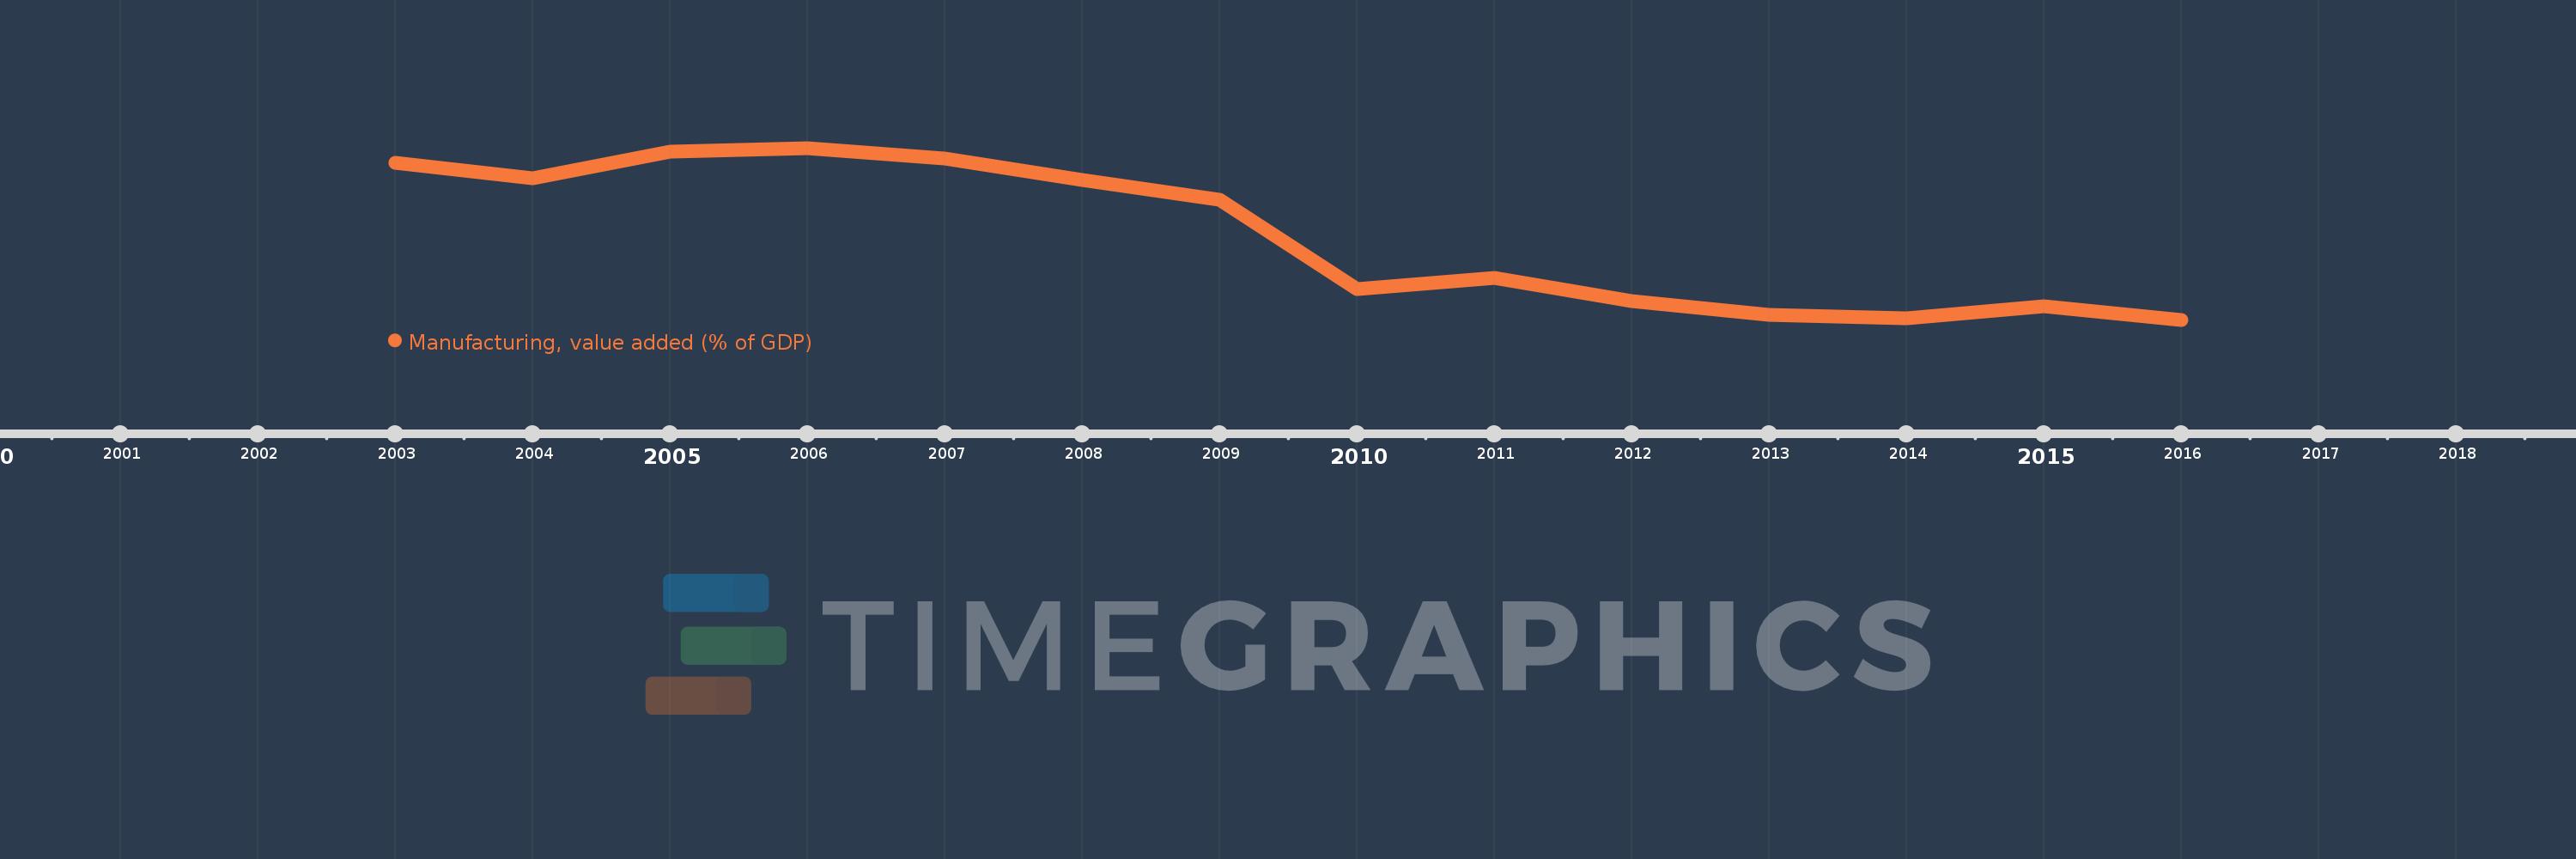
This timeline shows a graph from 2003 to 2016 of Europe & Central Asia (excluding high income). No data until 2002. Number of actual observations by date: 14.
Source name:
World Development Indicators
Source organization:
World Bank national accounts data, and OECD National Accounts data files.
Categories, topics:
Economy & Growth
Last updated:
apr 23, 2017
Indicators value changes by year
Meaning:
16.712
Minimum:
14.944
jan 1, 2016
Maximum:
18.58
jan 1, 2006
At the date of observation
Value
Absolute change
Change from the previous value
jan 1, 2003
18.269
+18.269
0.0%
jan 1, 2004
17.937
-0.331
-1.81%
jan 1, 2005
18.507
+0.57
3.18%
jan 1, 2006
18.58
+0.072
0.39%
jan 1, 2007
18.356
-0.224
-1.21%
jan 1, 2008
17.898
-0.457
-2.49%
jan 1, 2009
17.479
-0.42
-2.34%
jan 1, 2010
15.588
-1.891
-10.82%
jan 1, 2011
15.83
+0.242
1.55%
jan 1, 2012
15.335
-0.495
-3.13%
jan 1, 2013
15.046
-0.289
-1.88%
jan 1, 2014
14.976
-0.071
-0.47%
jan 1, 2015
15.225
+0.25
1.67%
jan 1, 2016
14.944
-0.281
-1.85%
Ranking of countries by current statistics by years