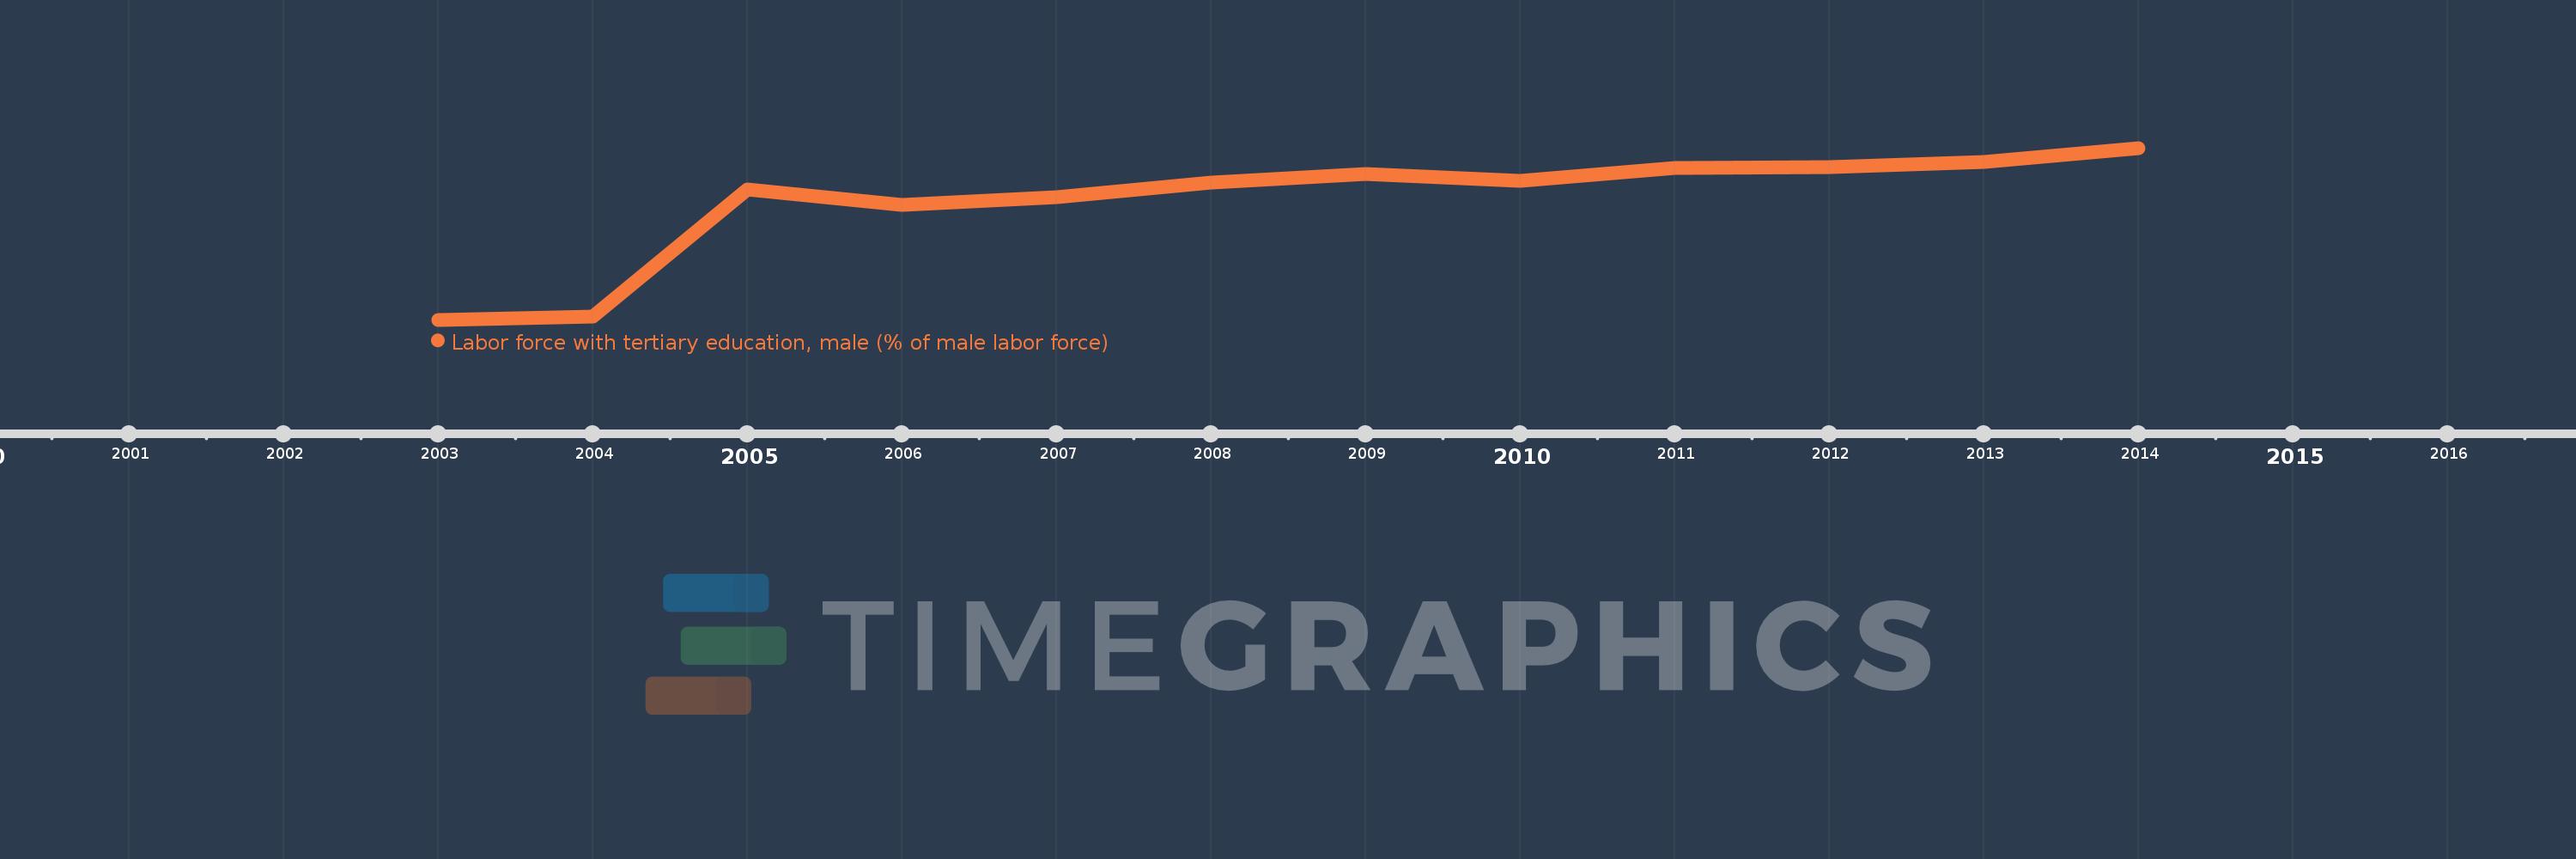
This timeline shows a graph from 2003 to 2014 of Europe & Central Asia (IDA & IBRD countries). No data until 2002. Number of actual observations by date: 12.
Source name:
World Development Indicators
Source organization:
International Labour Organization, Key Indicators of the Labour Market database.
Categories, topics:
Education, Social Protection & Labor, Gender
Last updated:
apr 23, 2017
Indicators value changes by year
Meaning:
28.043
Minimum:
18.181
jan 1, 2003
Maximum:
32.419
jan 1, 2014
At the date of observation
Value
Absolute change
Change from the previous value
jan 1, 2003
18.181
+18.181
0.0%
jan 1, 2004
18.463
+0.282
1.55%
jan 1, 2005
29.014
+10.552
57.15%
jan 1, 2006
27.671
-1.344
-4.63%
jan 1, 2007
28.357
+0.687
2.48%
jan 1, 2008
29.52
+1.162
4.1%
jan 1, 2009
30.269
+0.749
2.54%
jan 1, 2010
29.715
-0.553
-1.83%
jan 1, 2011
30.759
+1.044
3.51%
jan 1, 2012
30.862
+0.103
0.33%
jan 1, 2013
31.284
+0.422
1.37%
jan 1, 2014
32.419
+1.136
3.63%
Ranking of countries by current statistics by years