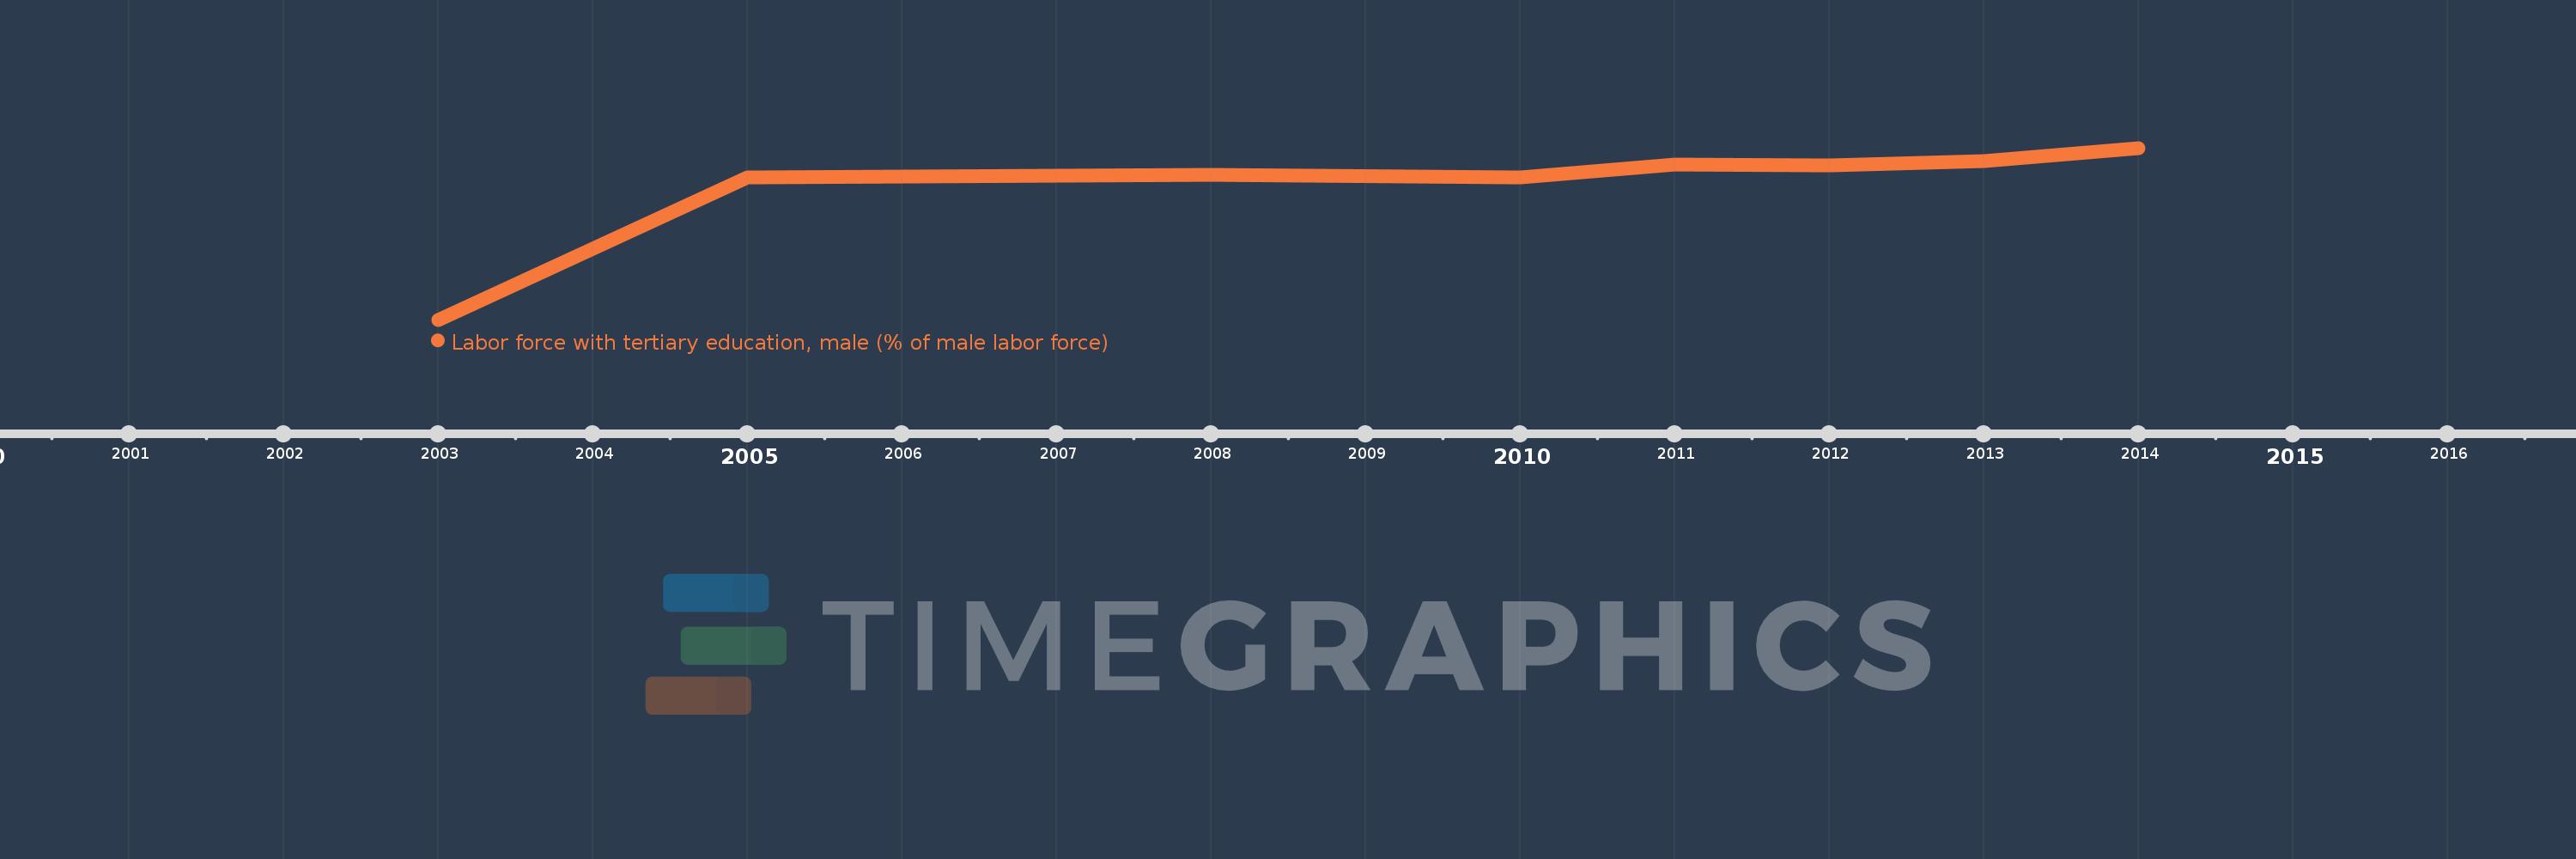
This timeline shows a graph from 2003 to 2014 of Europe & Central Asia (excluding high income). No data until 2002. Number of actual observations by date: 8.
Source name:
World Development Indicators
Source organization:
International Labour Organization, Key Indicators of the Labour Market database.
Categories, topics:
Education, Social Protection & Labor, Gender
Last updated:
apr 23, 2017
Indicators value changes by year
Meaning:
30.538
Minimum:
19.231
jan 1, 2003
Maximum:
33.748
jan 1, 2014
At the date of observation
Value
Absolute change
Change from the previous value
jan 1, 2003
19.231
+19.231
0.0%
jan 1, 2005
31.273
+12.041
62.61%
jan 1, 2008
31.453
+0.18
0.58%
jan 1, 2010
31.288
-0.165
-0.52%
jan 1, 2011
32.361
+1.073
3.43%
jan 1, 2012
32.306
-0.054
-0.17%
jan 1, 2013
32.646
+0.339
1.05%
jan 1, 2014
33.748
+1.102
3.38%
Ranking of countries by current statistics by years