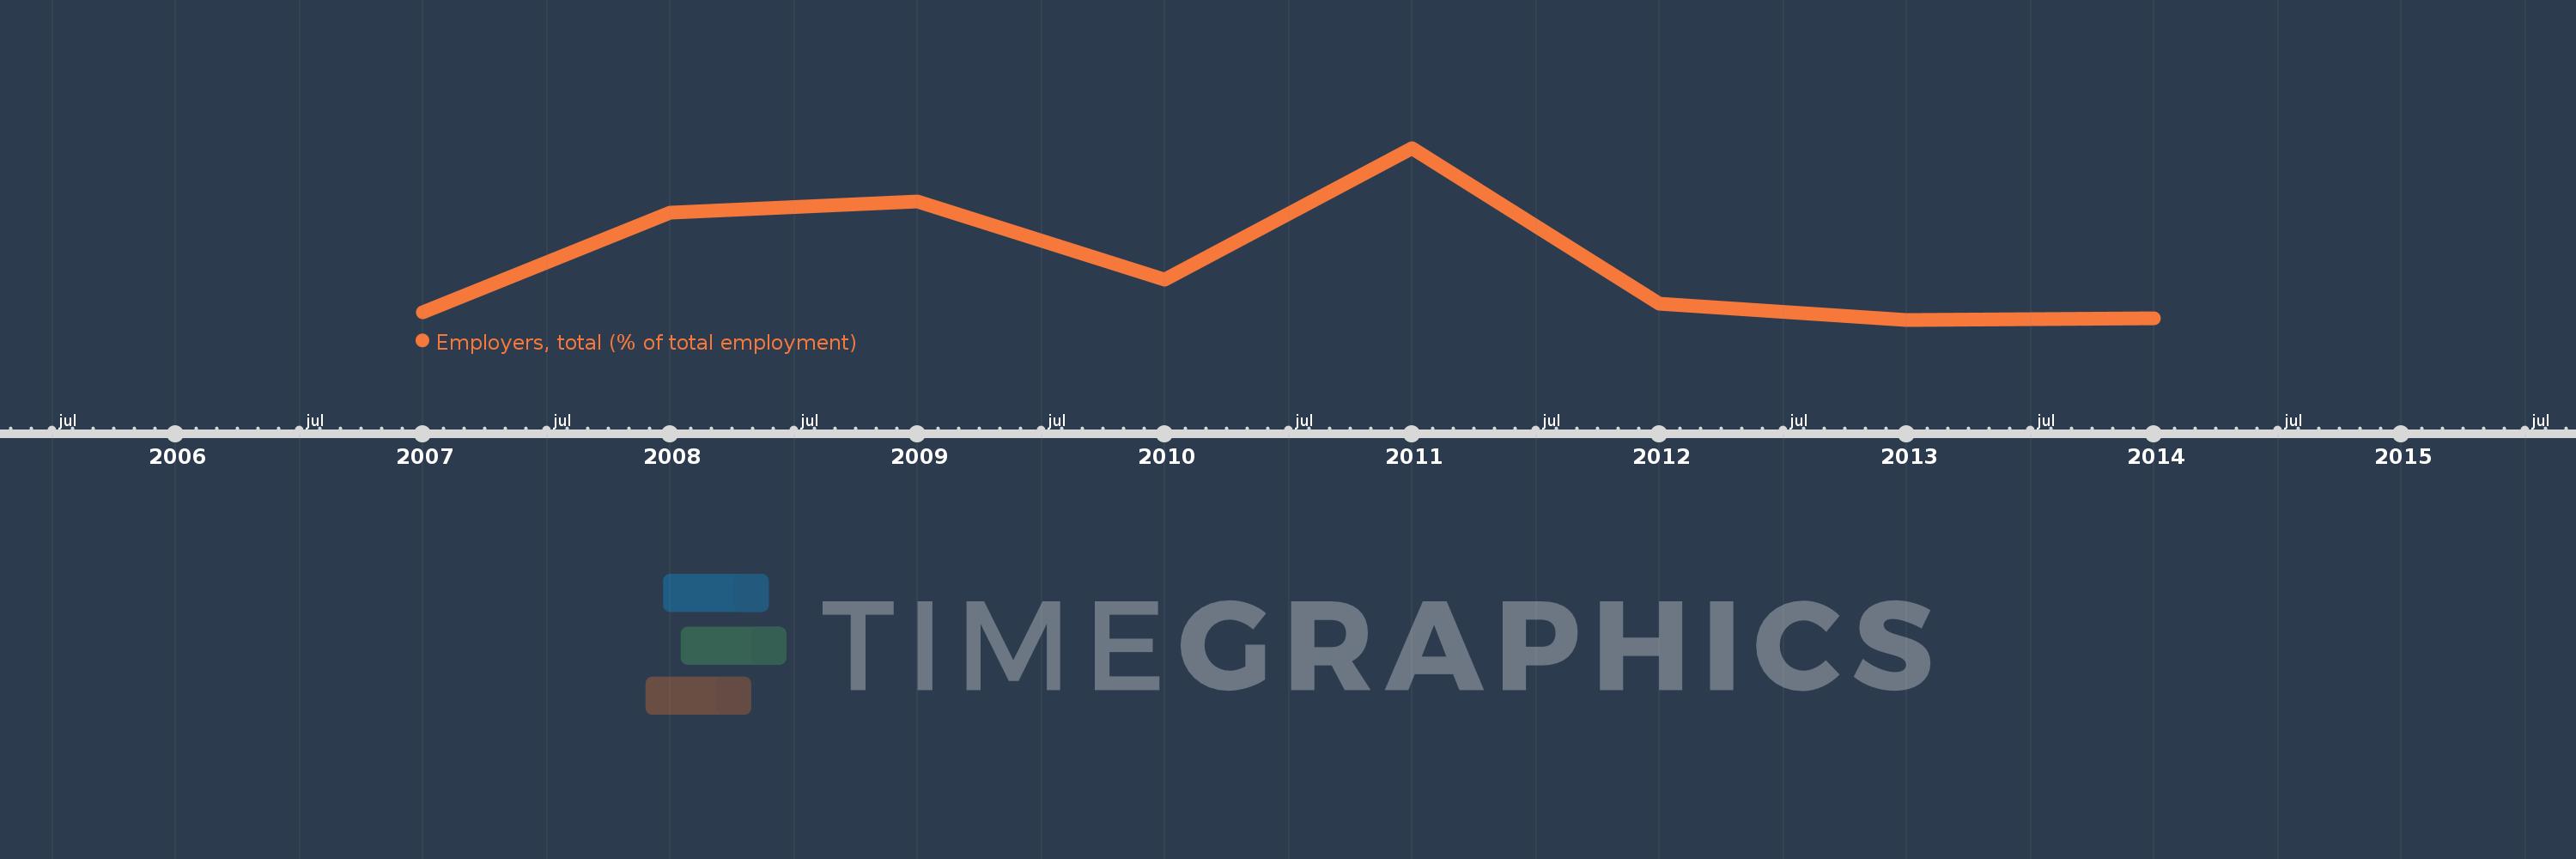
This timeline shows a graph from 2007 to 2014 of Europe & Central Asia (IDA & IBRD countries). No data until 2006. Number of actual observations by date: 8.
Source name:
World Development Indicators
Source organization:
ILO Key Indicators of the Labour Market (KILM).
Categories, topics:
Social Protection & Labor
Last updated:
apr 23, 2017
Indicators value changes by year
Meaning:
2.505
Minimum:
2.394
jan 1, 2013
Maximum:
2.724
jan 1, 2011
At the date of observation
Value
Absolute change
Change from the previous value
jan 1, 2007
2.409
+2.409
0.0%
jan 1, 2008
2.599
+0.19
7.87%
jan 1, 2009
2.621
+0.023
0.87%
jan 1, 2010
2.471
-0.151
-5.75%
jan 1, 2011
2.724
+0.253
10.25%
jan 1, 2012
2.425
-0.299
-10.97%
jan 1, 2013
2.394
-0.031
-1.26%
jan 1, 2014
2.396
+0.001
0.05%
Ranking of countries by current statistics by years