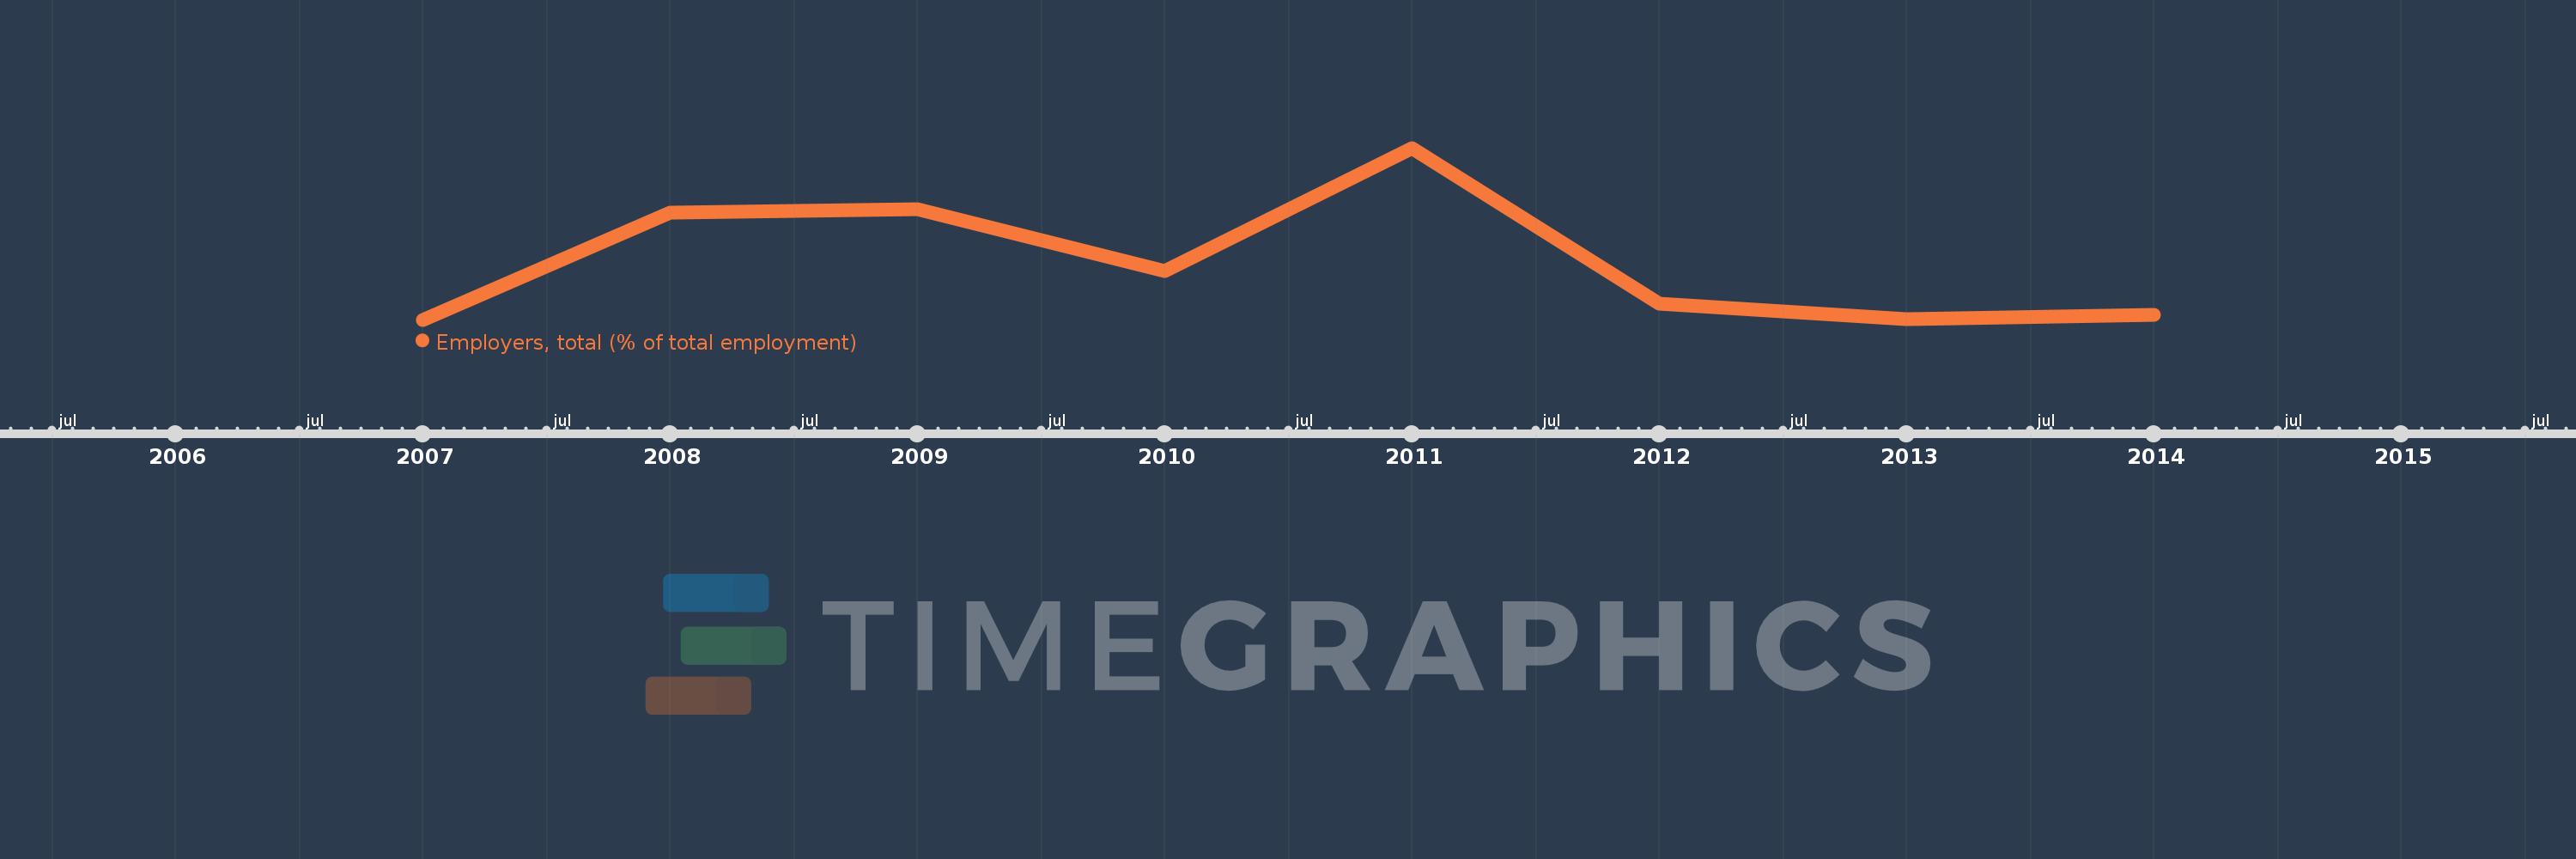
This timeline shows a graph from 2007 to 2014 of Europe & Central Asia (excluding high income). No data until 2006. Number of actual observations by date: 8.
Source name:
World Development Indicators
Source organization:
ILO Key Indicators of the Labour Market (KILM).
Categories, topics:
Social Protection & Labor
Last updated:
apr 23, 2017
Indicators value changes by year
Meaning:
2.288
Minimum:
2.176
jan 1, 2007
Maximum:
2.51
jan 1, 2011
At the date of observation
Value
Absolute change
Change from the previous value
jan 1, 2007
2.176
+2.176
0.0%
jan 1, 2008
2.384
+0.208
9.54%
jan 1, 2009
2.391
+0.007
0.31%
jan 1, 2010
2.27
-0.121
-5.07%
jan 1, 2011
2.51
+0.24
10.57%
jan 1, 2012
2.208
-0.302
-12.02%
jan 1, 2013
2.178
-0.03
-1.36%
jan 1, 2014
2.185
+0.007
0.32%
Ranking of countries by current statistics by years