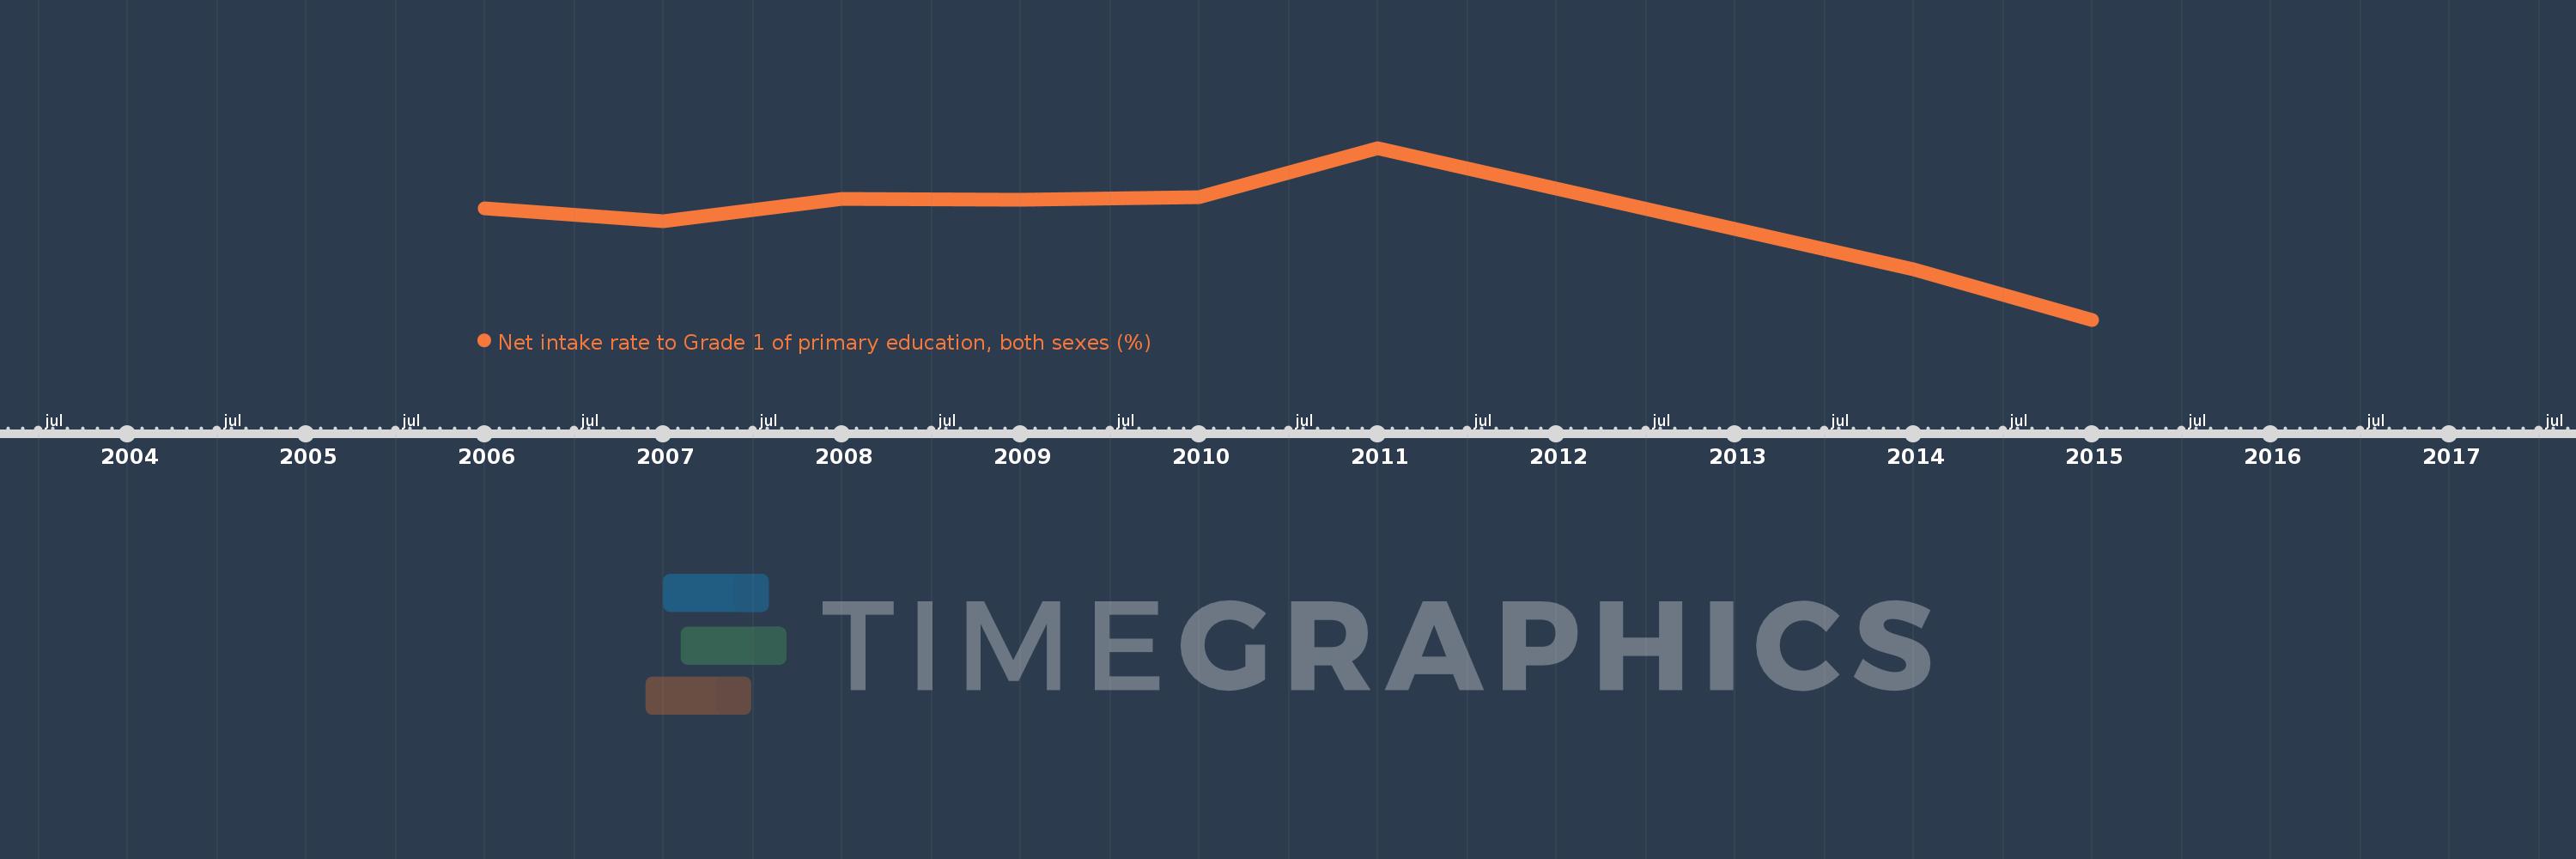
This timeline shows a graph from 2006 to 2015 of Europe & Central Asia (excluding high income). No data until 2005. Number of actual observations by date: 8.
Source name:
World Development Indicators
Source organization:
UNESCO Institute for Statistics
Categories, topics:
Education
Last updated:
apr 23, 2017
Indicators value changes by year
Meaning:
74.806
Minimum:
73.517
jan 1, 2015
Maximum:
75.745
jan 1, 2011
At the date of observation
Value
Absolute change
Change from the previous value
jan 1, 2006
74.958
+74.958
0.0%
jan 1, 2007
74.79
-0.168
-0.22%
jan 1, 2008
75.086
+0.296
0.4%
jan 1, 2009
75.068
-0.019
-0.03%
jan 1, 2010
75.104
+0.036
0.05%
jan 1, 2011
75.745
+0.641
0.85%
jan 1, 2014
74.175
-1.57
-2.07%
jan 1, 2015
73.517
-0.658
-0.89%
Ranking of countries by current statistics by years