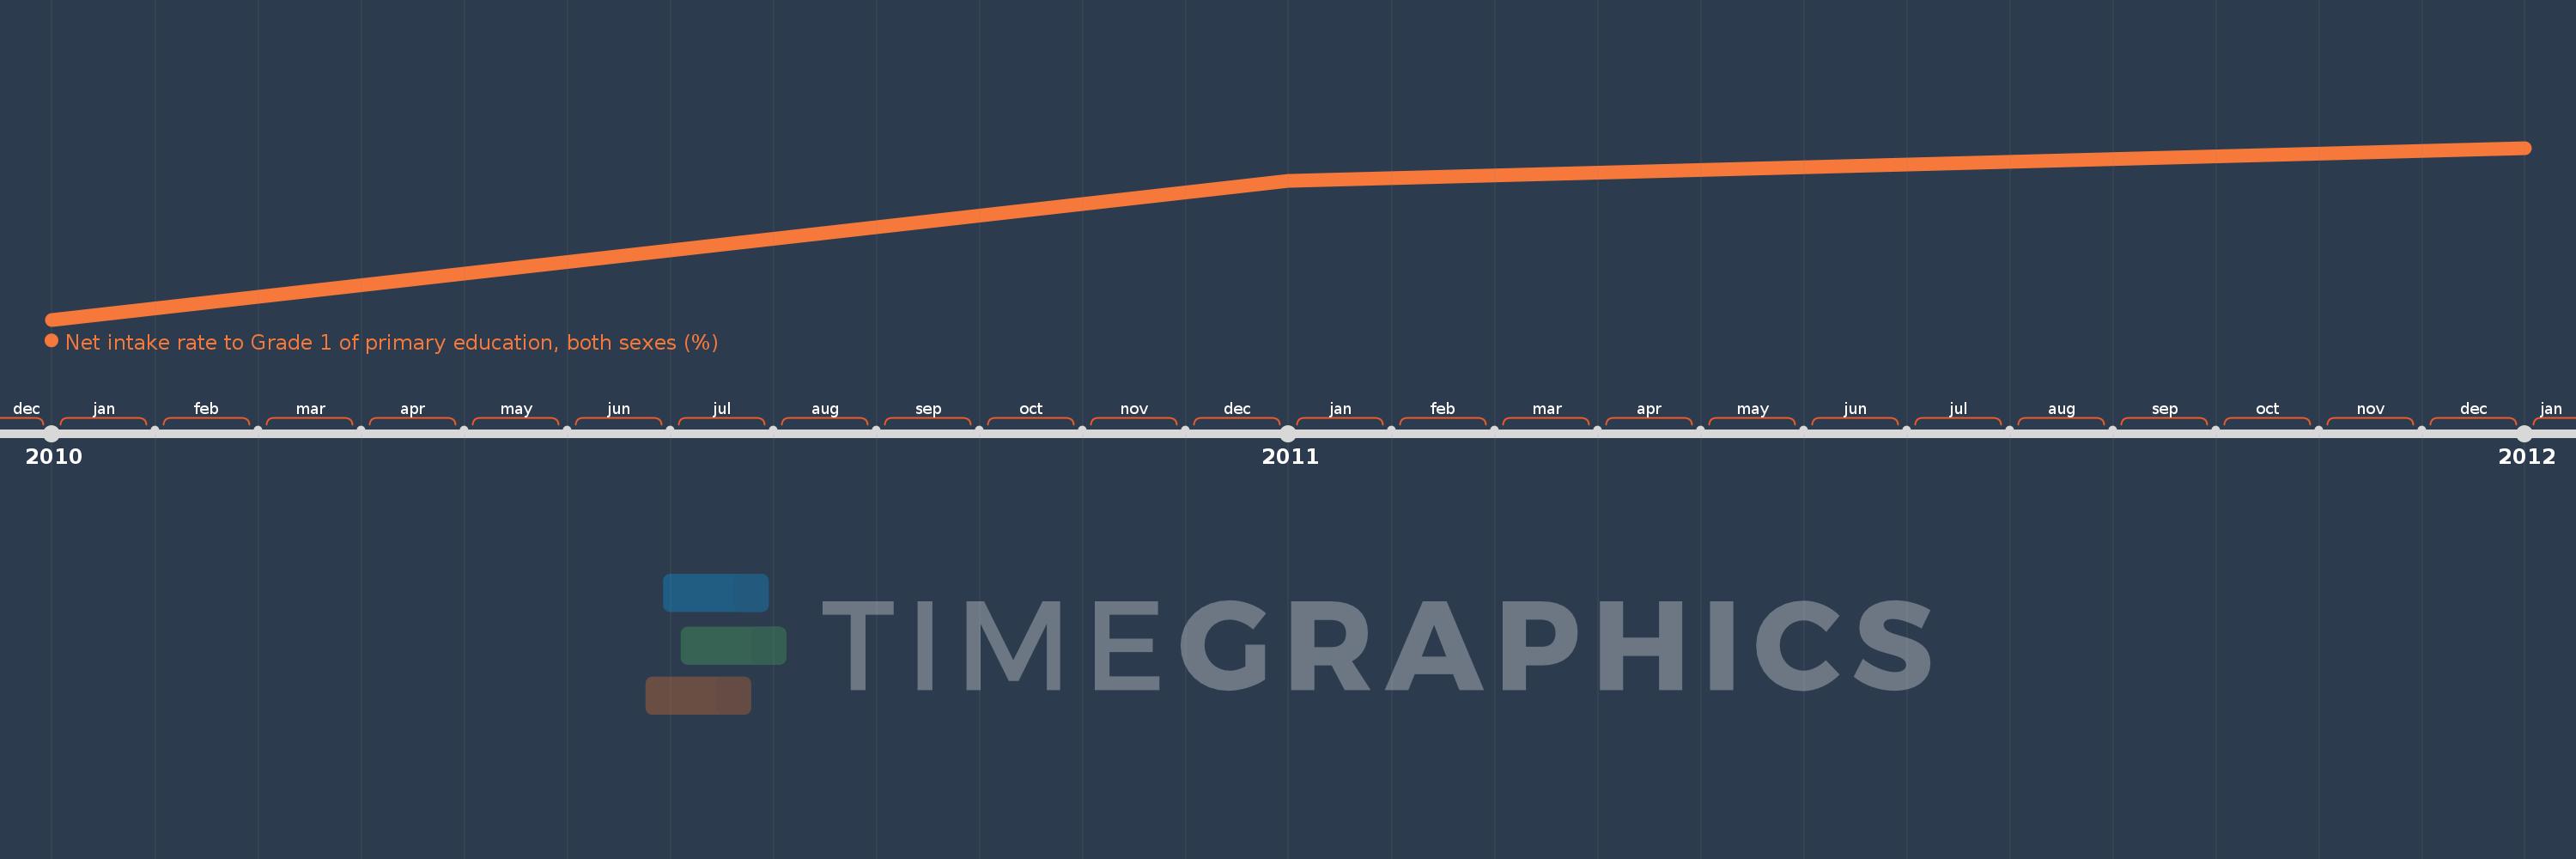
This timeline shows a graph from 2010 to 2012 of East Asia & Pacific (excluding high income). No data until 2009. Number of actual observations by date: 3.
Source name:
World Development Indicators
Source organization:
UNESCO Institute for Statistics
Categories, topics:
Education
Last updated:
apr 23, 2017
Indicators value changes by year
Meaning:
66.853
Minimum:
66.171
jan 1, 2010
Maximum:
67.303
jan 1, 2012
At the date of observation
Value
Absolute change
Change from the previous value
jan 1, 2010
66.171
+66.171
0.0%
jan 1, 2011
67.086
+0.915
1.38%
jan 1, 2012
67.303
+0.216
0.32%
Ranking of countries by current statistics by years