30
/
AIzaSyAYiBZKx7MnpbEhh9jyipgxe19OcubqV5w
April 1, 2024
284061
West Bank and Gaza
PSE
true
2
1
Rural population
2016,2015,2014,2013,2012,2011,2010,2009,2008,2007,2006,2005,2004,2003,2002,2001,2000,1999,1998,1997,1996,1995,1994,1993,1992,1991
Download
Global statistics library →West Bank and Gaza →

Rural population

This statistics in other country:

AfghanistanAlbaniaAlgeriaAmerican SamoaAndorraAngolaAntigua and BarbudaArab WorldArgentinaArmeniaArubaAustraliaAustriaAzerbaijanBahamas, TheBahrainBangladeshBarbadosBelarusBelgiumBelizeBeninBermudaBhutanBoliviaBosnia and HerzegovinaBotswanaBrazilBritish Virgin IslandsBrunei DarussalamBulgariaBurkina FasoBurundiCabo VerdeCambodiaCameroonCanadaCaribbean small statesCayman IslandsCentral African RepublicCentral Europe and the BalticsChadChannel IslandsChileChinaColombiaComorosCongo, Dem. Rep.Congo, Rep.Costa RicaCote d'IvoireCroatiaCubaCuracaoCyprusCzech RepublicDenmarkDjiboutiDominicaDominican RepublicEarly-demographic dividendEast Asia & PacificEast Asia & Pacific (excluding high income)East Asia & Pacific (IDA & IBRD countries)EcuadorEgypt, Arab Rep.El SalvadorEquatorial GuineaEritreaEstoniaEthiopiaEuro areaEurope & Central AsiaEurope & Central Asia (excluding high income)Europe & Central Asia (IDA & IBRD countries)European UnionFaroe IslandsFijiFinlandFragile and conflict affected situationsFranceFrench PolynesiaGabonGambia, TheGeorgiaGermanyGhanaGibraltarGreeceGreenlandGrenadaGuamGuatemalaGuineaGuinea-BissauGuyanaHaitiHeavily indebted poor countries (HIPC)High incomeHondurasHong Kong SAR, ChinaHungaryIBRD onlyIcelandIDA & IBRD totalIDA blendIDA onlyIDA totalIndiaIndonesiaIran, Islamic Rep.IraqIrelandIsle of ManIsraelItalyJamaicaJapanJordanKazakhstanKenyaKiribatiKorea, Dem. People’s Rep.Korea, Rep.KuwaitKyrgyz RepublicLao PDRLate-demographic dividendLatin America & Caribbean Latin America & Caribbean (excluding high income)Latin America & the Caribbean (IDA & IBRD countries)LatviaLeast developed countries: UN classificationLebanonLesothoLiberiaLibyaLiechtensteinLithuaniaLow & middle incomeLow incomeLower middle incomeLuxembourgMacao SAR, ChinaMacedonia, FYRMadagascarMalawiMalaysiaMaldivesMaliMaltaMarshall IslandsMauritaniaMauritiusMexicoMicronesia, Fed. Sts.Middle East & North AfricaMiddle East & North Africa (excluding high income)Middle East & North Africa (IDA & IBRD countries)Middle incomeMoldovaMonacoMongoliaMontenegroMoroccoMozambiqueMyanmarNamibiaNauruNepalNetherlandsNew CaledoniaNew ZealandNicaraguaNigerNigeriaNorth AmericaNorthern Mariana IslandsNorwayOECD membersOmanOther small statesPacific island small statesPakistanPalauPanamaPapua New GuineaParaguayPeruPhilippinesPolandPortugalPost-demographic dividendPre-demographic dividendPuerto RicoQatarRomaniaRussian FederationRwandaSamoaSan MarinoSao Tome and PrincipeSaudi ArabiaSenegalSerbiaSeychellesSierra LeoneSingaporeSint Maarten (Dutch part)Slovak RepublicSloveniaSmall statesSolomon IslandsSomaliaSouth AfricaSouth AsiaSouth Asia (IDA & IBRD)South SudanSpainSri LankaSt. Kitts and NevisSt. LuciaSt. Vincent and the GrenadinesSub-Saharan Africa Sub-Saharan Africa (excluding high income)Sub-Saharan Africa (IDA & IBRD countries)SudanSurinameSwazilandSwedenSwitzerlandSyrian Arab RepublicTajikistanTanzaniaThailandTimor-LesteTogoTongaTrinidad and TobagoTunisiaTurkeyTurkmenistanTurks and Caicos IslandsTuvaluUgandaUkraineUnited Arab EmiratesUnited KingdomUnited StatesUpper middle incomeUruguayUzbekistanVanuatuVenezuela, RBVietnamVirgin Islands (U.S.)West Bank and GazaWorldYemen, Rep.ZambiaZimbabwe

Timeline:

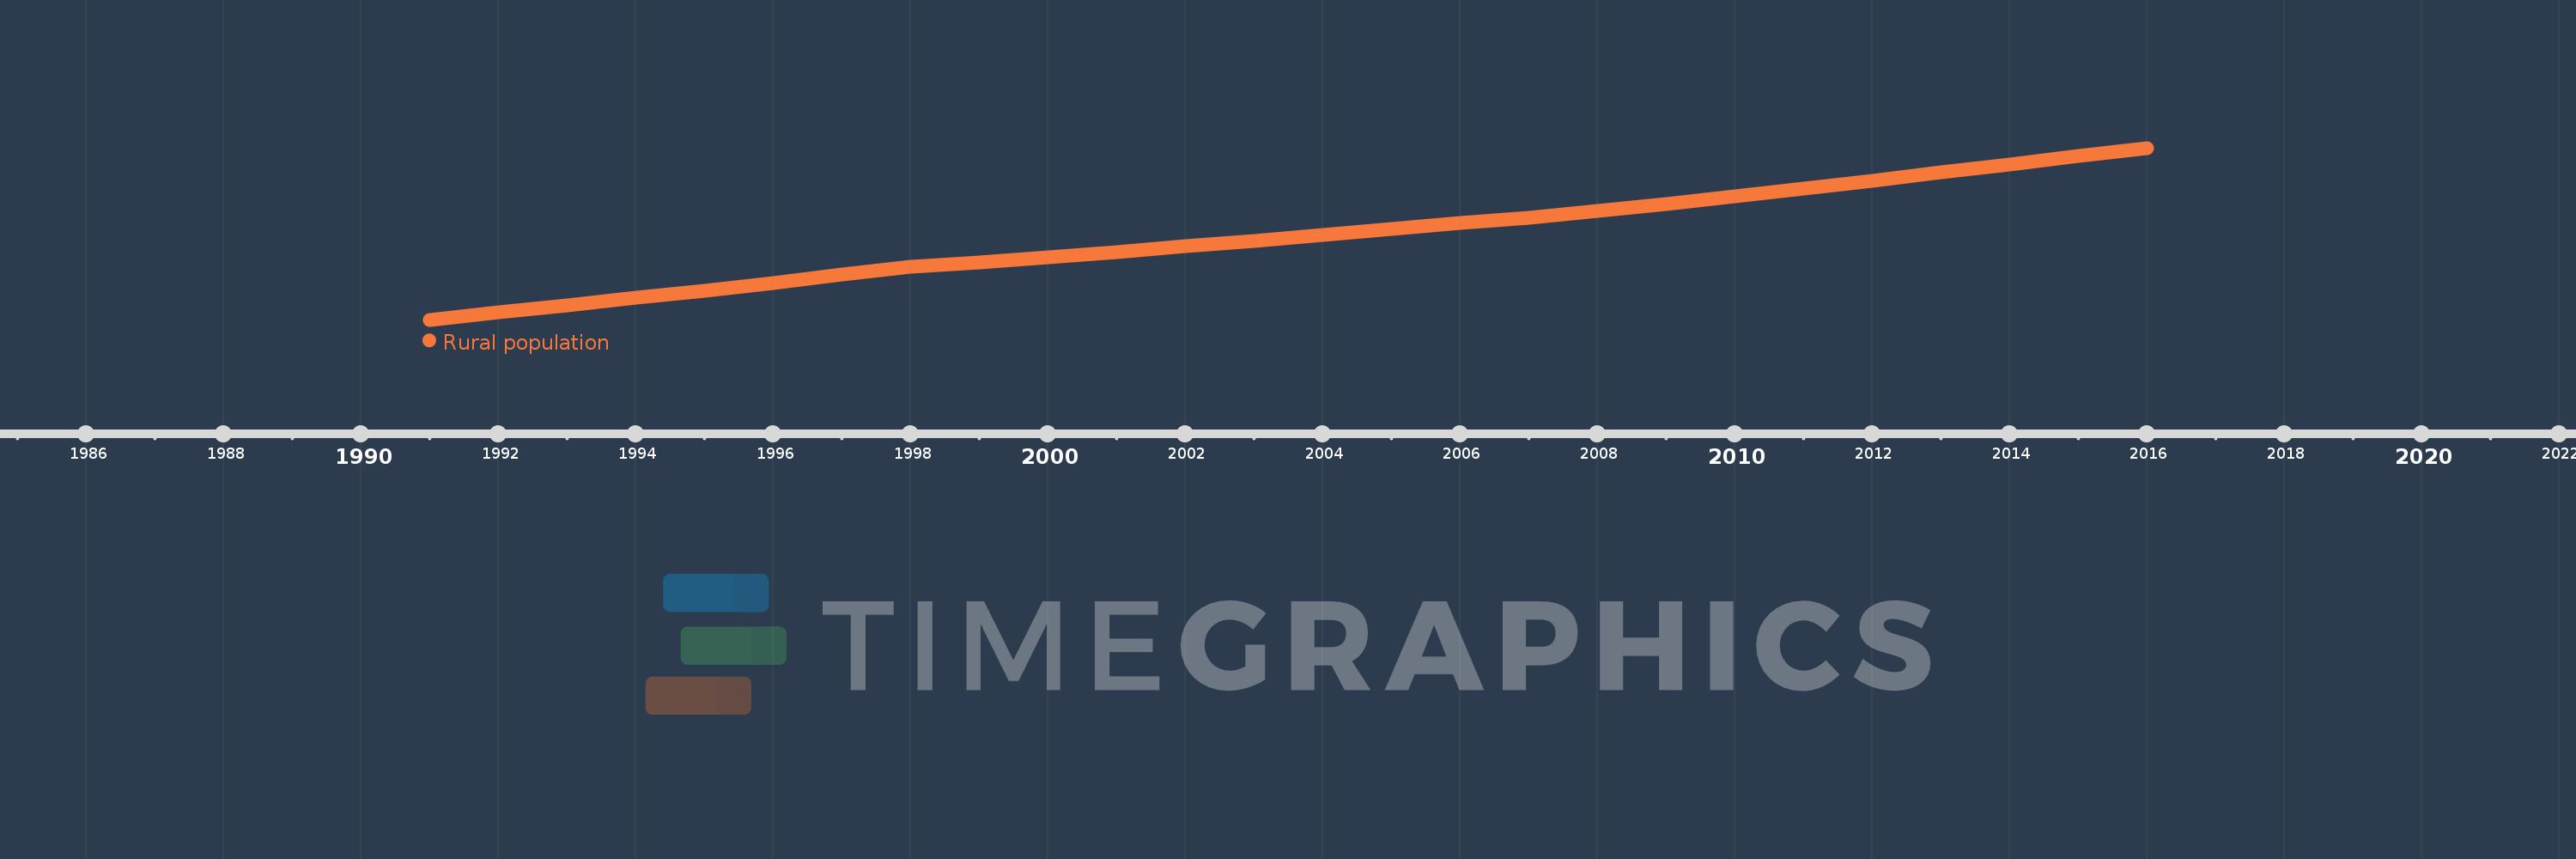
This timeline shows a graph from 1991 to 2016 of West Bank and Gaza. No data until 1990. Number of actual observations by date: 26.

Source name:

World Development Indicators

Source organization:

The data on urban population shares used to estimate rural population come from the United Nations, World Urbanization Prospects. Total population figures are World Bank estimates.

Categories, topics:

Agriculture & Rural Development

Last updated:

apr 23, 2017

Indicators value changes by year

Meaning:
860.836K
Minimum:
638.796K
jan 1, 1991
Maximum:
1.094 mln
jan 1, 2016
At the date of observation
Value
Absolute change
Change from the previous value
jan 1, 1991
638.796K
+638.796K
0.0%
jan 1, 1992
657.5K
+18.704K
2.93%
jan 1, 1993
676.641K
+19.141K
2.91%
jan 1, 1994
696.293K
+19.652K
2.9%
jan 1, 1995
716.42K
+20.127K
2.89%
jan 1, 1996
737.055K
+20.635K
2.88%
jan 1, 1997
758.154K
+21.099K
2.86%
jan 1, 1998
779.829K
+21.675K
2.86%
jan 1, 1999
790.656K
+10.827K
1.39%
jan 1, 2000
804.767K
+14.111K
1.78%
jan 1, 2001
819.109K
+14.342K
1.78%
jan 1, 2002
833.714K
+14.605K
1.78%
jan 1, 2003
848.526K
+14.812K
1.78%
jan 1, 2004
863.61K
+15.084K
1.78%
jan 1, 2005
878.906K
+15.296K
1.77%
jan 1, 2006
894.481K
+15.575K
1.77%
jan 1, 2007
910.309K
+15.828K
1.77%
jan 1, 2008
926.356K
+16.047K
1.76%
jan 1, 2009
945.785K
+19.429K
2.1%
jan 1, 2010
965.575K
+19.79K
2.09%
jan 1, 2011
985.703K
+20.128K
2.08%
jan 1, 2012
1.007 mln
+21.35K
2.17%
jan 1, 2013
1.029 mln
+21.791K
2.16%
jan 1, 2014
1.051 mln
+21.872K
2.13%
jan 1, 2015
1.073 mln
+21.838K
2.08%
jan 1, 2016
1.094 mln
+21.838K
2.04%

Ranking of countries by current statistics by years