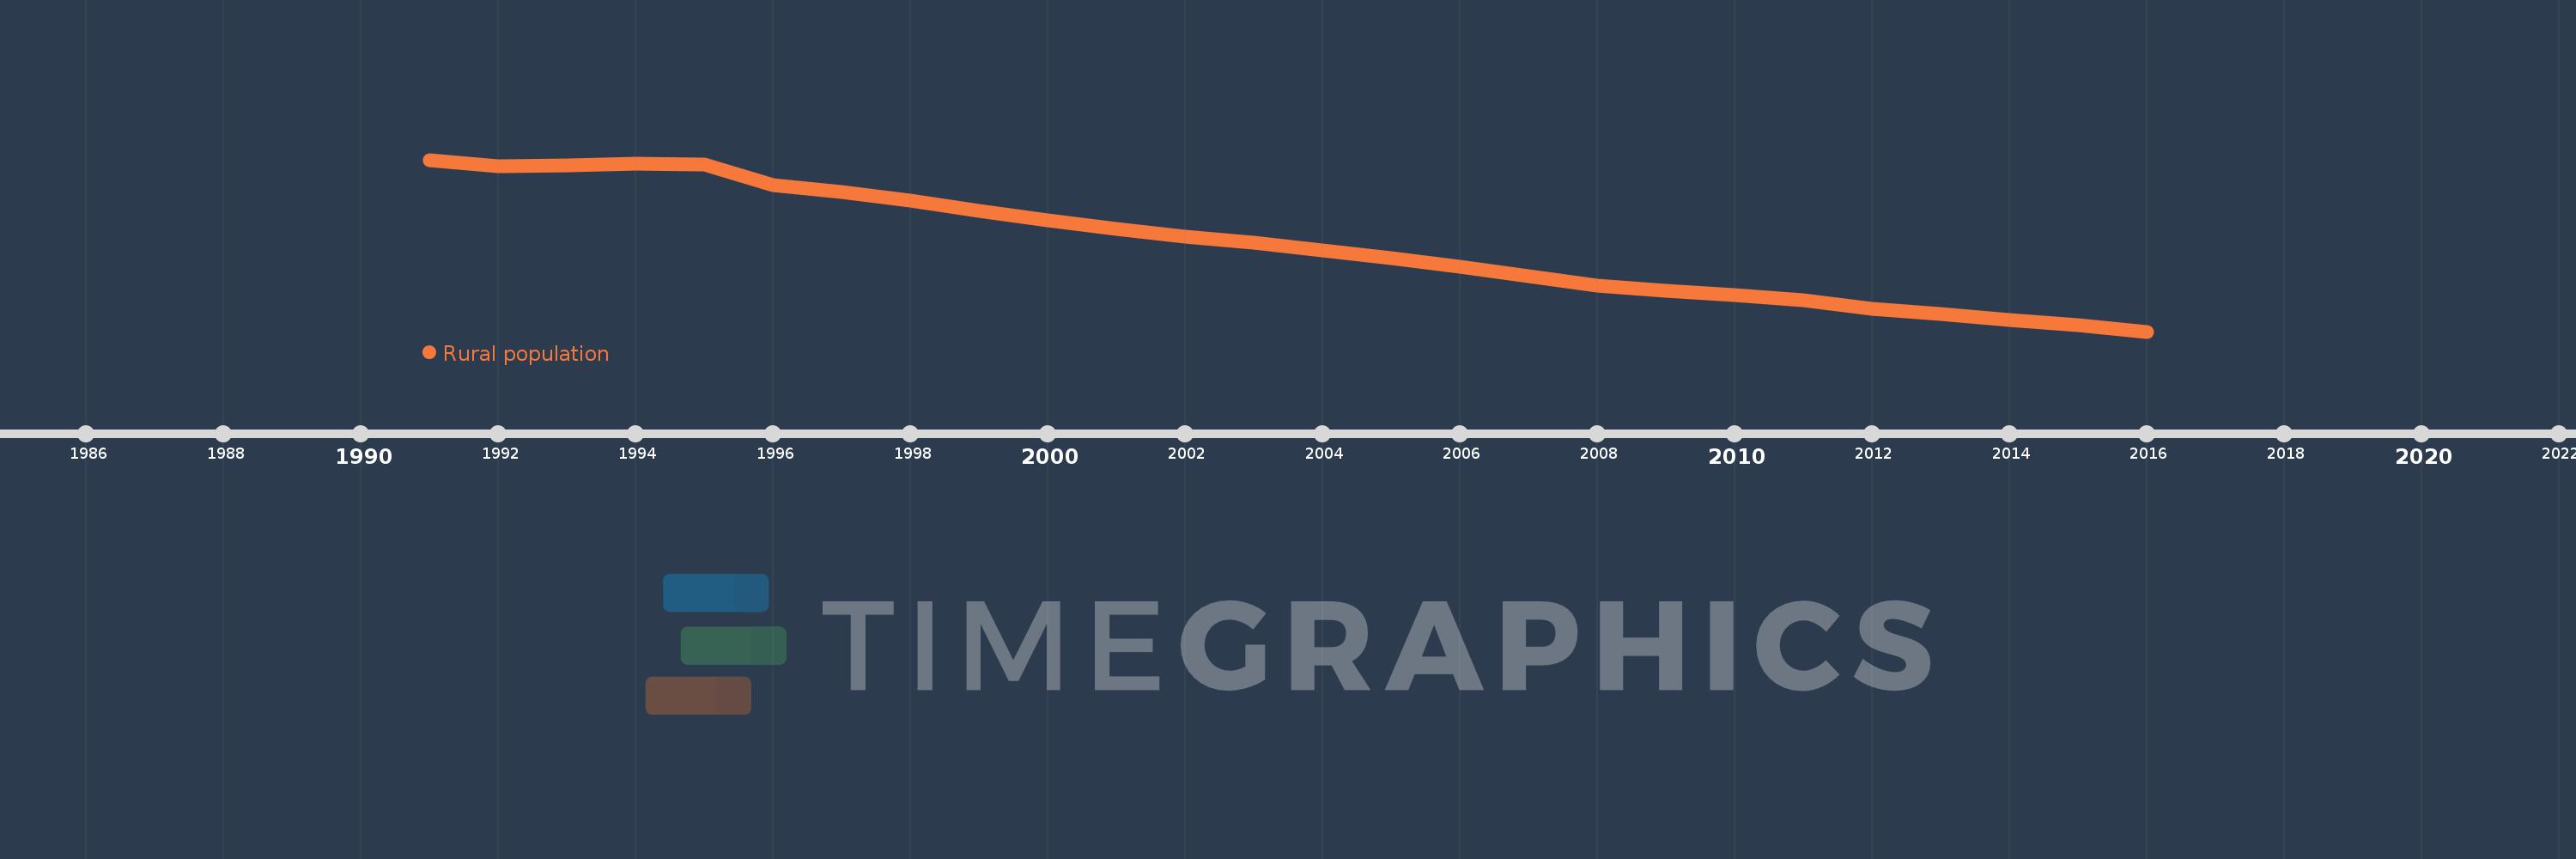
This timeline shows a graph from 1991 to 2016 of Serbia. No data until 1990. Number of actual observations by date: 26.
Source name:
World Development Indicators
Source organization:
The data on urban population shares used to estimate rural population come from the United Nations, World Urbanization Prospects. Total population figures are World Bank estimates.
Categories, topics:
Agriculture & Rural Development
Last updated:
apr 23, 2017
Indicators value changes by year
Meaning:
3.463 mln
Minimum:
3.155 mln
jan 1, 2016
Maximum:
3.763 mln
jan 1, 1991
At the date of observation
Value
Absolute change
Change from the previous value
jan 1, 1991
3.763 mln
+3.763 mln
0.0%
jan 1, 1992
3.739 mln
-23.703K
-0.63%
jan 1, 1993
3.744 mln
+4.435K
0.12%
jan 1, 1994
3.749 mln
+5.182K
0.14%
jan 1, 1995
3.745 mln
-3.602K
-0.1%
jan 1, 1996
3.672 mln
-73.432K
-1.96%
jan 1, 1997
3.648 mln
-24.21K
-0.66%
jan 1, 1998
3.617 mln
-30.555K
-0.84%
jan 1, 1999
3.583 mln
-34.05K
-0.94%
jan 1, 2000
3.55 mln
-33.156K
-0.93%
jan 1, 2001
3.519 mln
-31.544K
-0.89%
jan 1, 2002
3.492 mln
-26.154K
-0.74%
jan 1, 2003
3.469 mln
-23.307K
-0.67%
jan 1, 2004
3.442 mln
-27.421K
-0.79%
jan 1, 2005
3.414 mln
-27.947K
-0.81%
jan 1, 2006
3.384 mln
-30.108K
-0.88%
jan 1, 2007
3.351 mln
-33.067K
-0.98%
jan 1, 2008
3.317 mln
-33.266K
-0.99%
jan 1, 2009
3.3 mln
-17.767K
-0.54%
jan 1, 2010
3.283 mln
-16.792K
-0.51%
jan 1, 2011
3.266 mln
-16.743K
-0.51%
jan 1, 2012
3.237 mln
-29.299K
-0.9%
jan 1, 2013
3.217 mln
-19.198K
-0.59%
jan 1, 2014
3.197 mln
-20.346K
-0.63%
jan 1, 2015
3.176 mln
-20.822K
-0.65%
jan 1, 2016
3.155 mln
-21.357K
-0.67%
Ranking of countries by current statistics by years