33
/
AIzaSyB4mHJ5NPEv-XzF7P6NDYXjlkCWaeKw5bc
November 30, 2025
283786
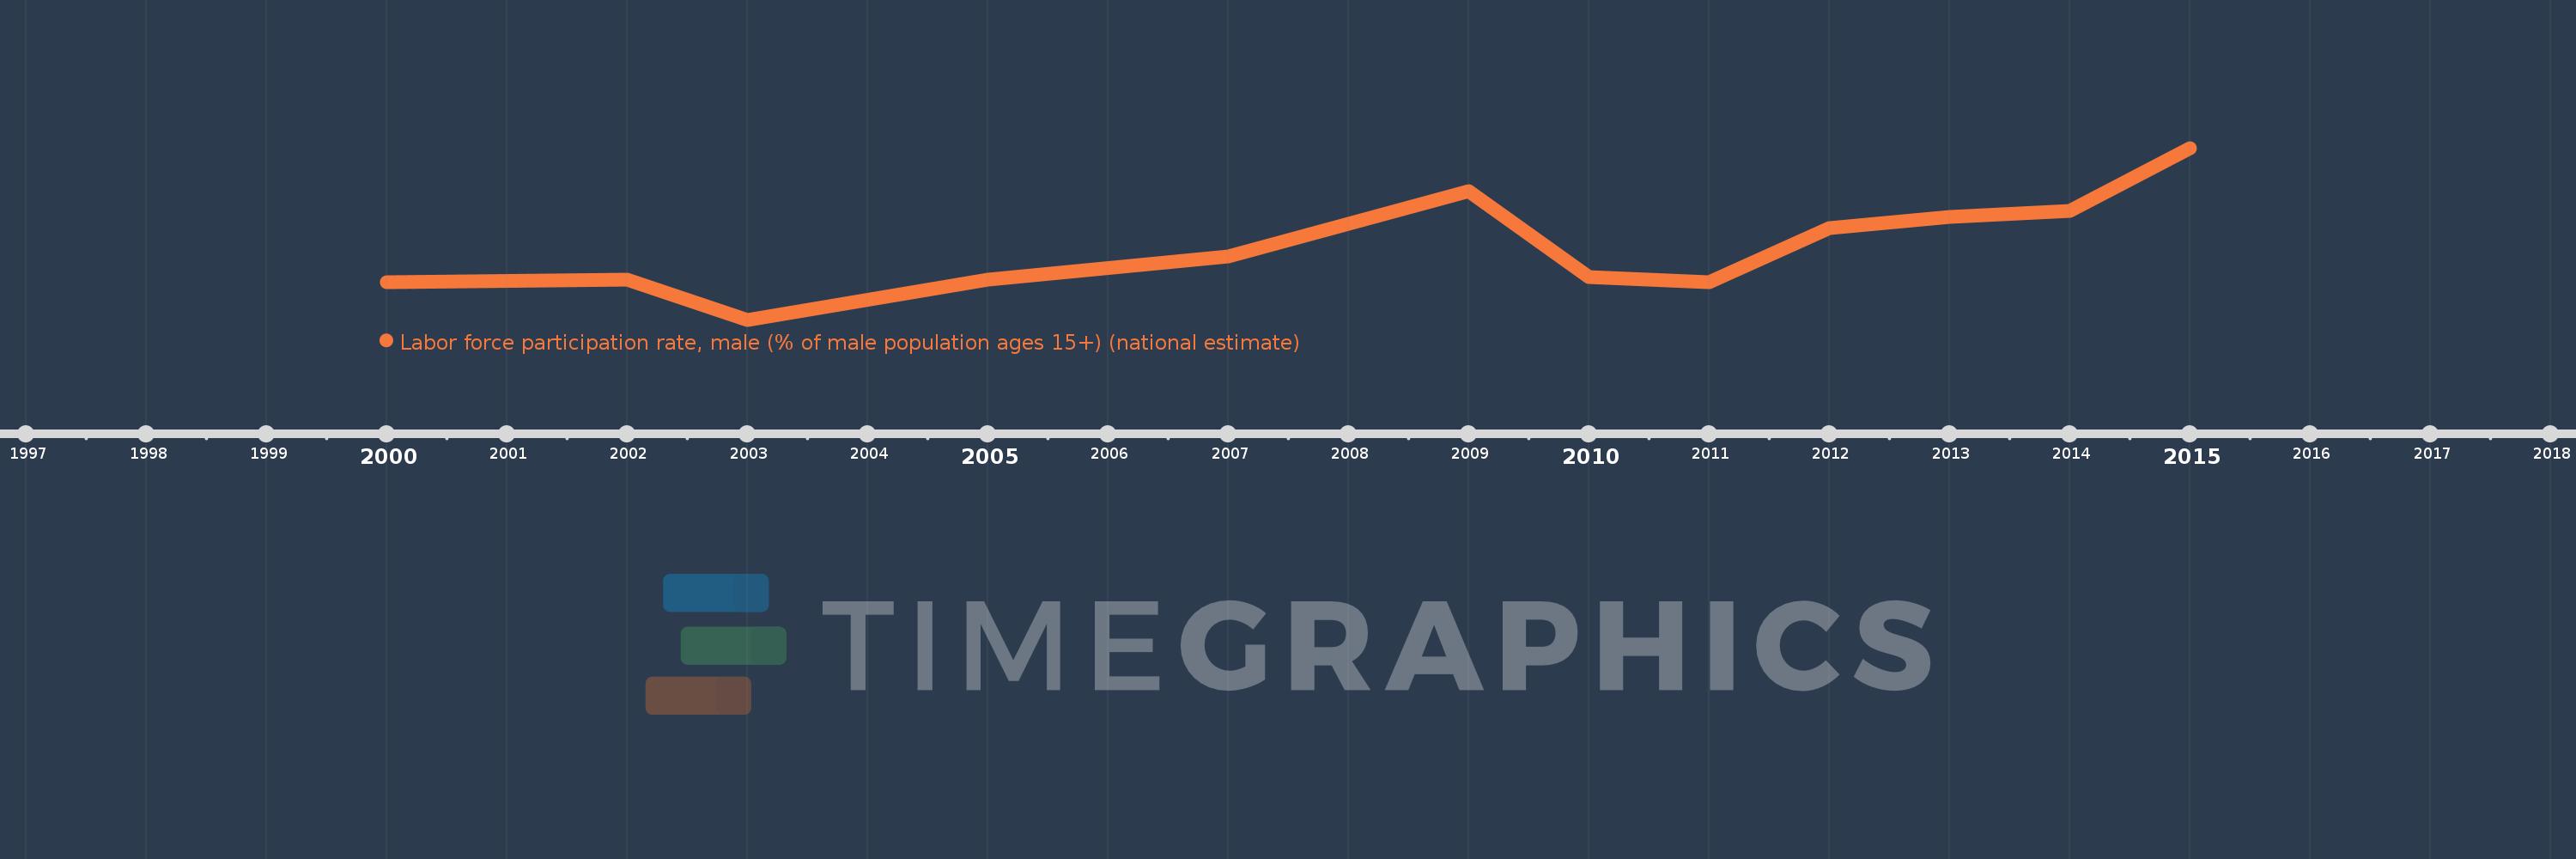
West Bank and Gaza
PSE
true
2
1
Labor force participation rate, male (% of male population ages 15+) (national estimate)
2015,2014,2013,2012,2011,2010,2009,2007,2005,2003,2002,2000